
Exhibit 99.1
Texas Pacific Land Corporation (NYSE: TPL) Investor Presentation – March 2024
Disclaimers This presentation has been designed to provide general information about Texas Pacific Land Corporation and its subsidiaries (“TPL” or the “Company”). Any information contained or referenced herein is suitable only as an introduction to the Company. The recipient is strongly encouraged to refer to and supplement this presentation with information the Company has filed with the Securities and Exchange Commission (“SEC”). The Company makes no representation or warranty, express or implied, as to the accuracy or completeness of the information contained in this presentation, and nothing contained herein is, or shall be, relied upon as a promise or representation, whether as to the past or to the future. This presentation does not purport to include all of the information that may be required to evaluate the subject matter herein and any recipient hereof should conduct its own independent analysis of the Company and the data contained or referred to herein. Unless otherwise stated, statements in this presentation are made as of the date of this presentation, and nothing shall create an implication that the information contained herein is correct as of any time after such date. TPL reserves the right to change any of its opinions expressed herein at any time as it deems appropriate. The Company disclaims any obligations to update the data, information or opinions contained herein or to notify the market or any other party of any such changes, other than required by law. Industry and Market Data The Company has neither sought nor obtained consent from any third party for the use of previously published information. Any such statements or information should not be viewed as indicating the support of such third party for the views expressed herein. The Company shall not be responsible or have any liability for any misinformation contained in any third party report, SEC or other regulatory filing. The industry in which the Company operates is subject to a high degree of uncertainty and risk due to a variety of factors, which could cause our results to differ materially from those expressed in these third - party publications. Some of the data included in this presentation is based on TPL’s good faith estimates, which are derived from TPL’s review of internal sources as well as the third party sources described above. All registered or unregistered service marks, trademarks and trade names referred to in this presentation are the property of their respective owners, and TPL’s use herein does not imply an affiliation with, or endorsement by, the owners of these service marks, trademarks and trade names. Forward - looking Statements This presentation contains certain forward - looking statements within the meaning of the U.S. federal securities laws that are based on TPL’s beliefs, as well as assumptions made by, and information currently available to, TPL, and therefore involve risks and uncertainties that are difficult to predict. These statements include, but are not limited to, statements about strategies, plans, objectives, expectations, intentions, expenditures and assumptions and other statements that are not historical facts. When used in this document, words such as “anticipate,” “believe,” “estimate,” “expect,” “intend,” “plan” and “project” and similar expressions are intended to identify forward - looking statements. You should not place undue reliance on these forward - looking statements. Although we believe our plans, intentions and expectations reflected in or suggested by the forward - looking statements we make in this presentation are reasonable, we may be unable to achieve these plans, intentions or expectations and actual results, performance or achievements may vary materially and adversely from those envisaged in this document. For more information concerning factors that could cause actual results to differ from those expressed or forecasted, see TPL’s annual report on Form 10 - K and quarterly reports on Form 10 - Q filed with the SEC. The tables, graphs, charts and other analyses provided throughout this document are provided for illustrative purposes only and there is no guarantee that the trends, outcomes or market conditions depicted on them will continue in the future. There is no assurance or guarantee with respect to the prices at which the Company’s common stock will trade, and such securities may not trade at prices that may be implied herein. TPL’s forecasts and expectations for future periods are dependent upon many assumptions, including the drilling and development plans of our customers, estimates of production and potential drilling locations, which may be affected by commodity price declines or other factors that are beyond TPL’s control. These materials are provided merely for general informational purposes and are not intended to be, nor should they be construed as 1) investment, financial, tax or legal advice, 2) a recommendation to buy or sell any security, or 3) an offer or solicitation to subscribe for or purchase any security. These materials do not consider the investment objective, financial situation, suitability or the particular need or circumstances of any specific individual who may receive or review this presentation, and may not be taken as advice on the merits of any investment decision. Although TPL believes the information herein to be reliable, the Company and persons acting on its behalf make no representation or warranty, express or implied, as to the accuracy or completeness of those statements or any other written or oral communication it makes, safe as provided for by law, and the Company expressly disclaims any liability relating to those statements or communications (or any inaccuracies or omissions therein). These cautionary statements qualify all forward - looking statements attributable to us or persons acting on our behalf. Non - GAAP Financial Measures In addition to amounts presented in accordance with generally accepted accounting principles in the United States of America (“GAAP”), this presentation includes certain supplemental non - GAAP measurements. These non - GAAP measurements are not to be considered more relevant or accurate than the measurements presented in accordance with GAAP. In compliance with requirements of the SEC, our non - GAAP measurements are reconciled to net income, the most directly comparable GAAP performance measure. In this presentation, TPL utilizes earnings before interest, taxes, depreciation and amortization (“EBITDA”), Adjusted EBITDA and free cash flow (“FCF”). TPL believes that EBITDA, Adjusted EBITDA and FCF are useful supplements as an indicator of operating and financial performance. EBITDA, Adjusted EBITDA and FCF are not presented as an alternative to net income and they should not be considered in isolation or as a substitute for net income. See Appendix for a reconciliation of these non - GAAP measures to net income, the most directly comparable financial measure calculated in accordance with GAAP. 2
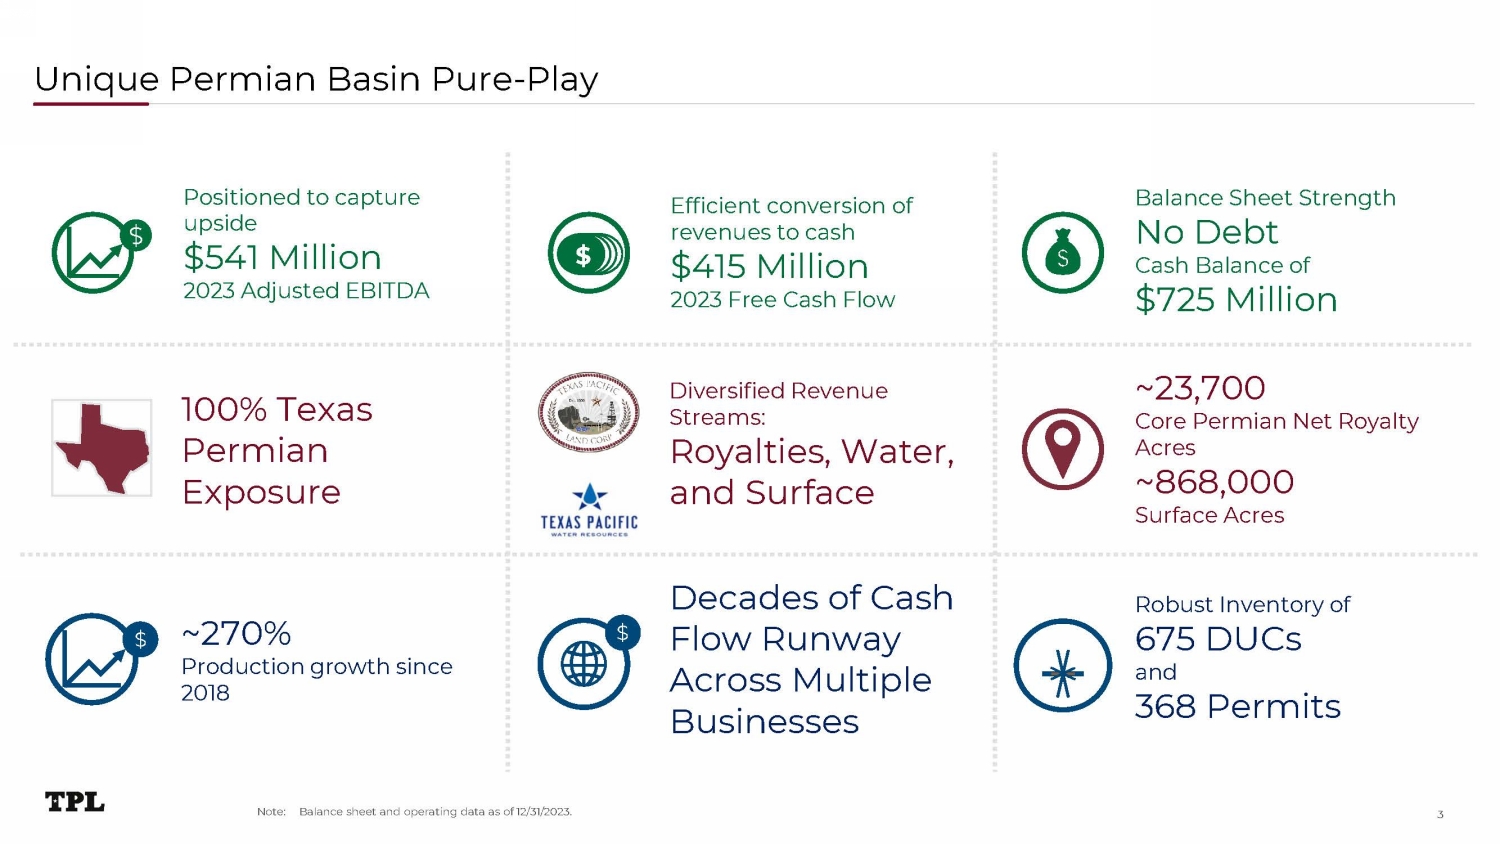
Unique Permian Basin Pure - Play Positioned to capture $ upside $541 Million 2023 Adjusted EBITDA Efficient conversion of revenues to cash $ $415 Million 2023 Free Cash Flow Balance Sheet Strength No Debt Cash Balance of $725 Million 100% Texas Permian Exposure Diversified Revenue Streams: Royalties, Water, and Surface ~23,700 Core Permian Net Royalty Acres ~868,000 Surface Acres $ ~270% Production growth since 2018 Decades of Cash $ Flow Runway Across Multiple Businesses Robust Inventory of 675 DUCs and 368 Permits 3 Note: Balance sheet and operating data as of 12/31/2023.
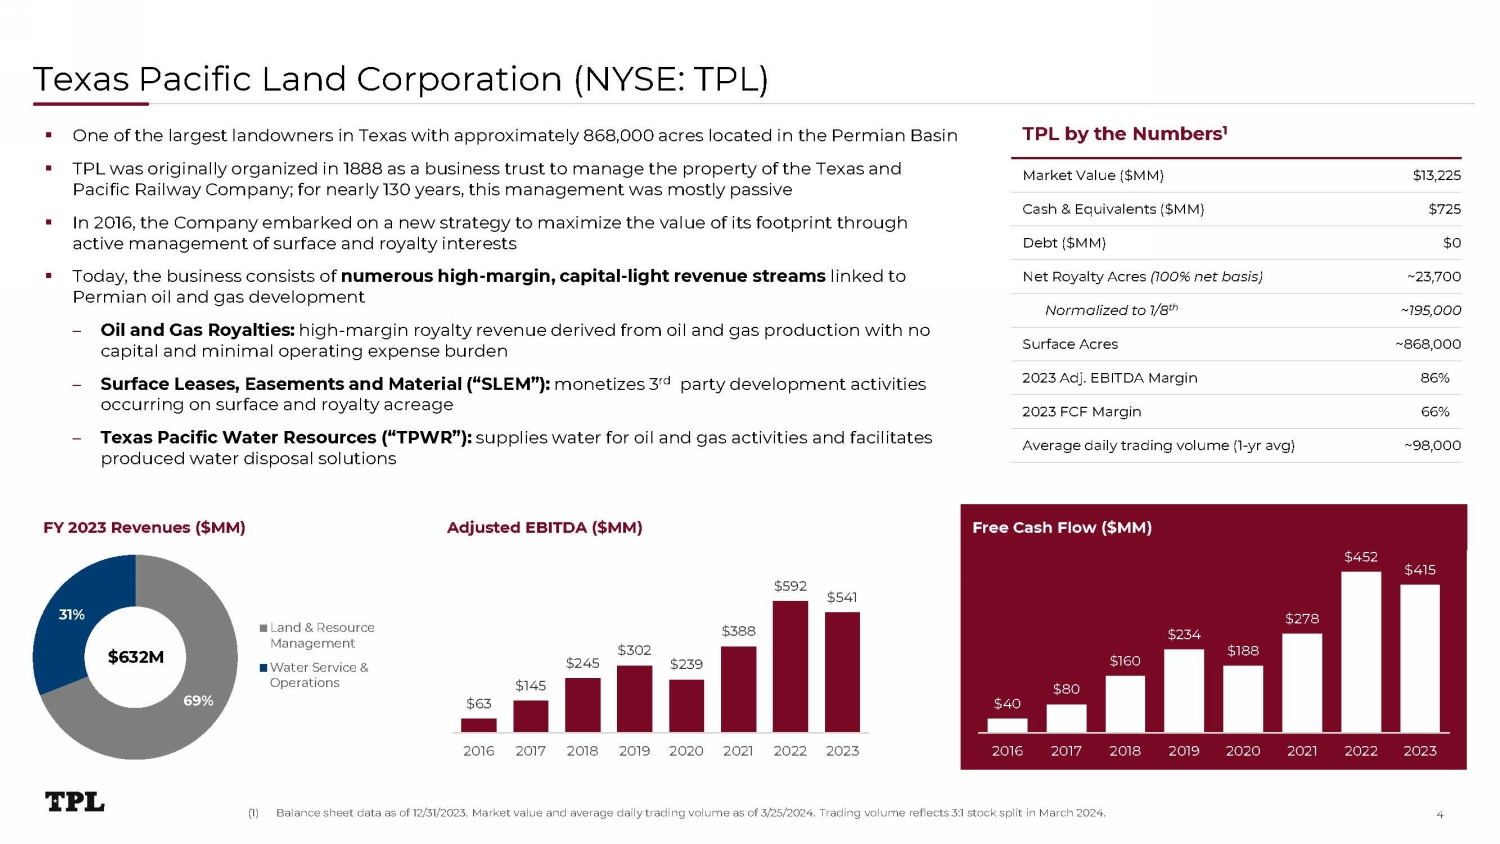
Texas Pacific Land Corporation (NYSE: TPL) TPL by the Numbers 1 Market Value ($MM) $13 ,225 Cash & Equivalents ($MM) $7 25 Debt ($MM) $0 Net Royalty Acres (100% net basis) ~ 2 3 , 7 00 Normalized to 1/8 th ~1 9 5 ,000 Surface Acres ~ 868,000 2023 Adj. EBITDA Margin 86% 2023 FCF Margin 66% Average daily trading volume (1 - yr avg) ~ 98,000 Free Cash Flow ($MM) FY 2023 Revenues ($MM) ▪ One of the largest landowners in Texas with approximately 868,000 acres located in the Permian Basin ▪ TPL was originally organized in 1888 as a business trust to manage the property of the Texas and Pacific Railway Company; for nearly 130 years, this management was mostly passive ▪ In 2016, the Company embarked on a new strategy to maximize the value of its footprint through active management of surface and royalty interests ▪ Today, the business consists of numerous high - margin, capital - light revenue streams linked to Permian oil and gas development – Oil and Gas Royalties: high - margin royalty revenue derived from oil and gas production with no capital and minimal operating expense burden – Surface Leases, Easements and Material (“SLEM”): monetizes 3 rd party development activities occurring on surface and royalty acreage – Texas Pacific Water Resources (“TPWR”): supplies water for oil and gas activities and facilitates produced water disposal solutions Adjusted EBITDA ($MM) 69% 31% Land & Resource Management Water Service & Operations $ 63 2 M $1 4 5 $ 2 4 5 $3 0 2 $ 2 39 $ 3 8 8 $ 5 9 2 $ 5 4 1 $ 8 0 $1 6 0 $ 2 34 $ 1 88 $ 2 78 $452 $ 4 1 5 $63 $40 2 0 1 6 2017 2 0 1 8 2 0 1 9 2 0 20 2021 2 0 22 2 0 23 2016 2017 2018 2019 2020 2021 2022 2023 4 (1) Balance sheet data as of 12/31/2023. Market value and average daily trading volume as of 3/25/2024. Trading volume reflects 3:1 stock split in March 2024.
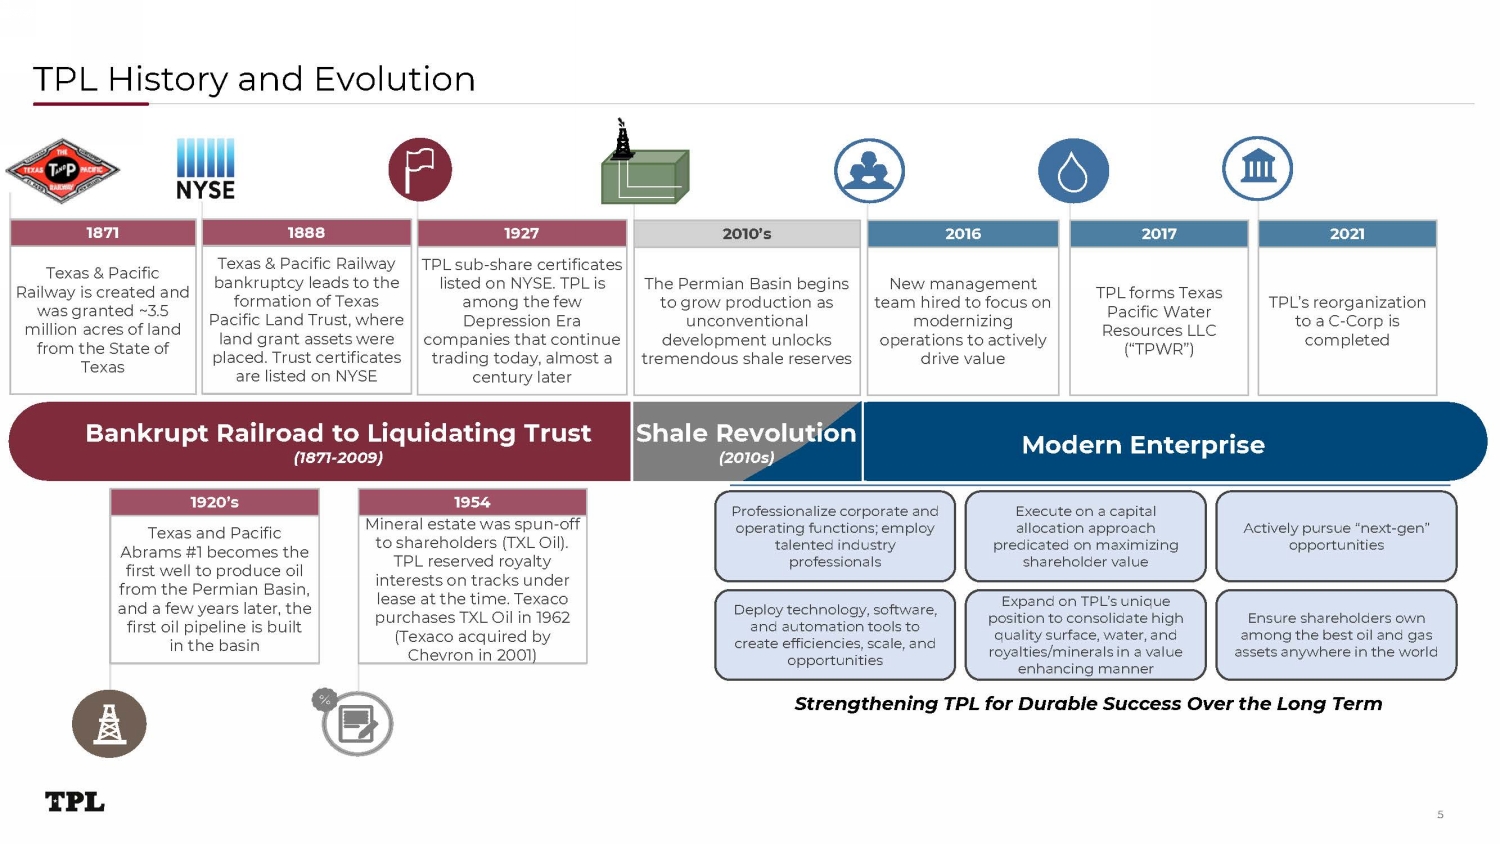
TPL History and Evolution Bankrupt Railroad to Liquidating Trust (1871 - 2009) Modern Enterprise 1888 Texas & Pacific Railway bankruptcy leads to the formation of Texas Pacific Land Trust, where land grant assets were placed. Trust certificates are listed on NYSE Texas and Pacific Abrams #1 becomes the first well to produce oil from the Permian Basin, and a few years later, the first oil pipeline is built in the basin 1920’s Mineral estate was spun - off to shareholders (TXL Oil). TPL reserved royalty interests on tracks under lease at the time. Texaco purchases TXL Oil in 1962 (Texaco acquired by Chevron in 2001) 1954 Texas & Pacific Railway is created and was granted ~3.5 million acres of land from the State of Texas 1871 The Permian Basin begins to grow production as unconventional development unlocks tremendous shale reserves 2010’s TPL forms Texas Pacific Water Resources LLC (“TPWR”) 2017 1927 TPL sub - share certificates listed on NYSE. TPL is among the few Depression Era companies that continue trading today, almost a century later 2021 TPL’s reorganization to a C - Corp is completed 2016 New management team hired to focus on modernizing operations to actively drive value Shale Revolution (2010s) Professionalize corporate and operating functions; employ talented industry professionals Execute on a capital allocation approach predicated on maximizing shareholder value Actively pursue “next - gen” opportunities Deploy technology, software, and automation tools to create efficiencies, scale, and opportunities Expand on TPL’s unique position to consolidate high quality surface, water, and royalties/minerals in a value enhancing manner Ensure shareholders own among the best oil and gas assets anywhere in the world 5 Strengthening TPL for Durable Success Over the Long Term
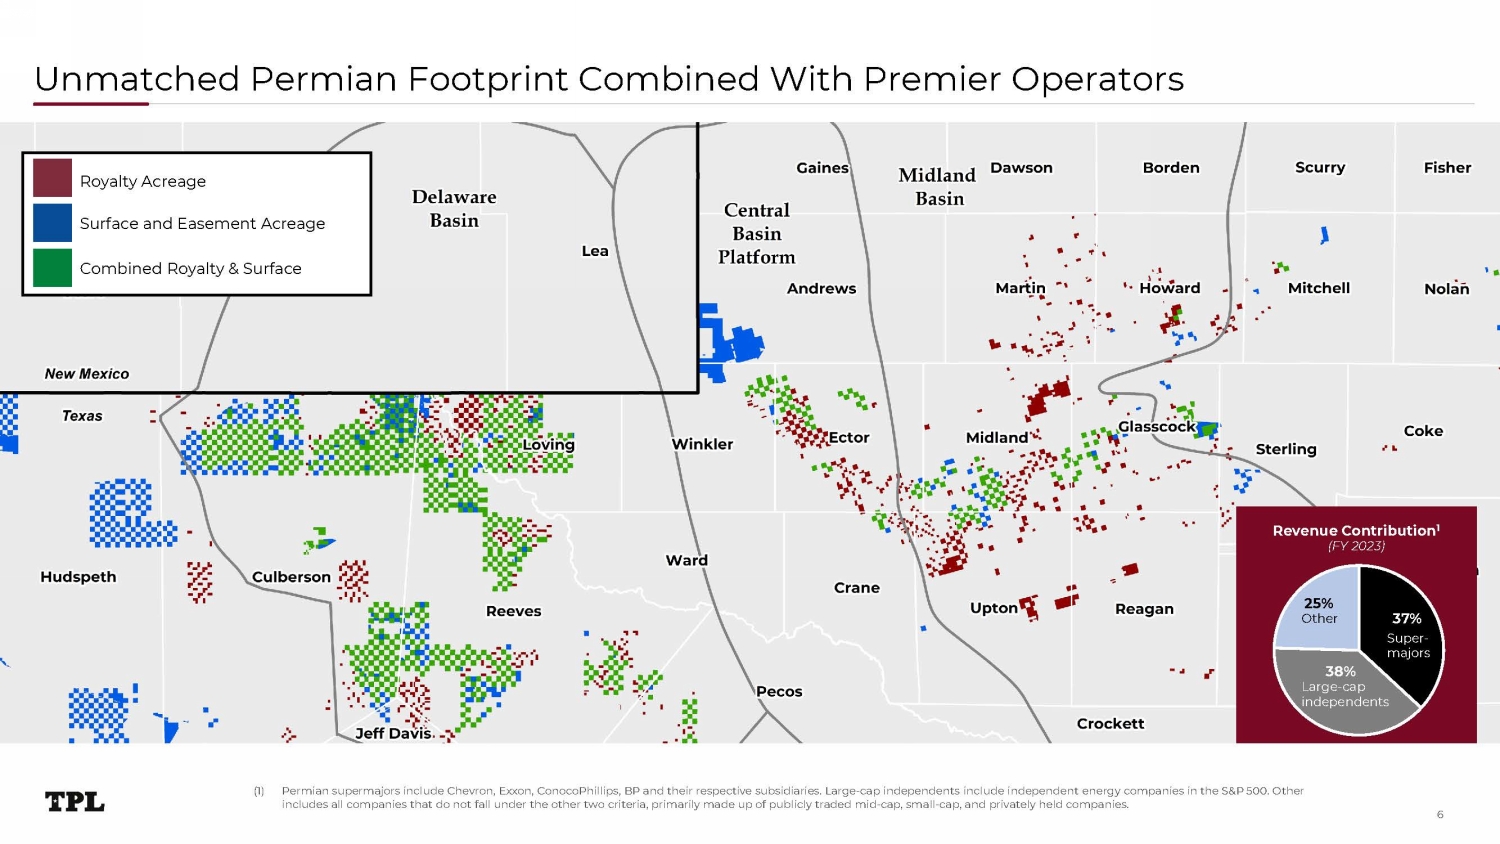
Unmatched Permian Footprint Combined With Premier Operators Royalty Acreage Surface and Easement Acreage Combined Royalty & Surface Revenue Contribution 1 (FY 2023) 6 37% Super - m a jo r s 38% Large - cap i n d ep e n d e n t s 25% Oth e r (1) Permian supermajors include Chevron, Exxon, ConocoPhillips, BP and their respective subsidiaries. Large - cap independents include independent energy companies in the S&P 500. Other includes all companies that do not fall under the other two criteria, primarily made up of publicly traded mid - cap, small - cap, and privately held companies.
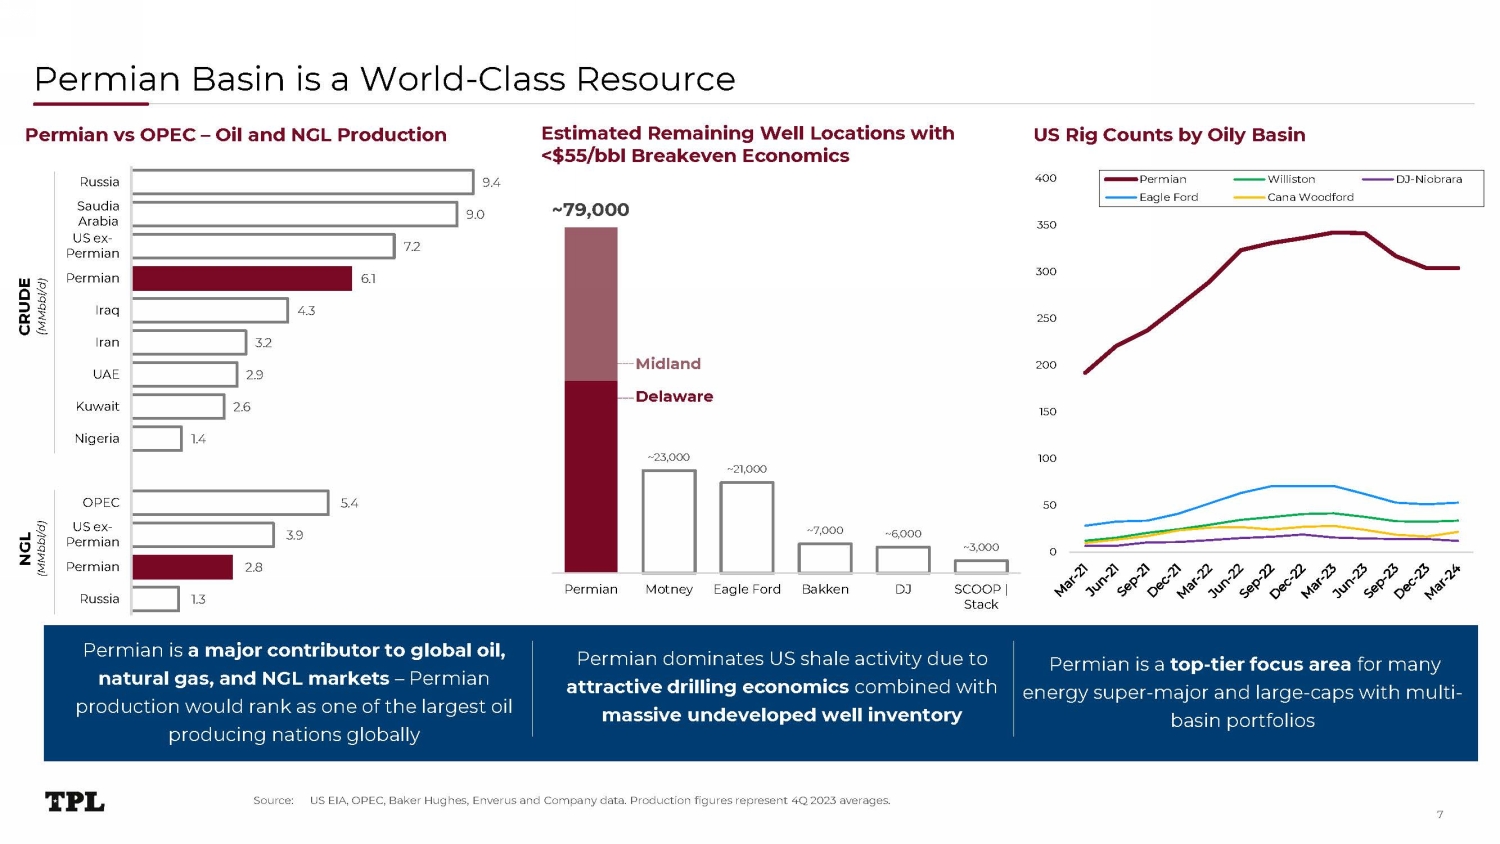
~7 9 , 000 ~ 2 3 , 000 ~ 2 1 , 000 ~ 7 , 000 ~ 6 , 000 ~ 3 , 000 P e r m i an M o t n e y Eagle Ford Bakken DJ SCOOP | Stack Permian Basin is a World - Class Resource Source: US EIA, OPEC, Baker Hughes, Enverus and Company data. Production figures represent 4Q 2023 averages. Estimated Remaining Well Locations with <$55/bbl Breakeven Economics Permian dominates US shale activity due to attractive drilling economics combined with massive undeveloped well inventory Permian is a top - tier focus area for many energy super - major and large - caps with multi - basin portfolios Permian is a major contributor to global oil, natural gas, and NGL markets – Permian production would rank as one of the largest oil producing nations globally 1.3 2 .8 3 . 9 5 . 4 1.4 2 .6 2 .9 3 .2 4. 3 6 .1 7 . 2 9 .0 9 .4 R u s s i a O P EC US ex - P e r m i an P e r m i an N i g e r i a Kuwait UAE I r an I r aq R u s s i a S a u d i a Arabia US ex - P e r m i an P e r m i an CR U D E ( MMbbl/d) NGL (MMbb l / d ) Permian vs OPEC – Oil and NGL Production US Rig Counts by Oily Basin Delaware M i d l a n d 0 50 1 0 0 15 0 2 0 0 25 0 3 0 0 3 50 4 00 DJ - Niobrara Permian Eagle Ford Williston Cana Woodford 7
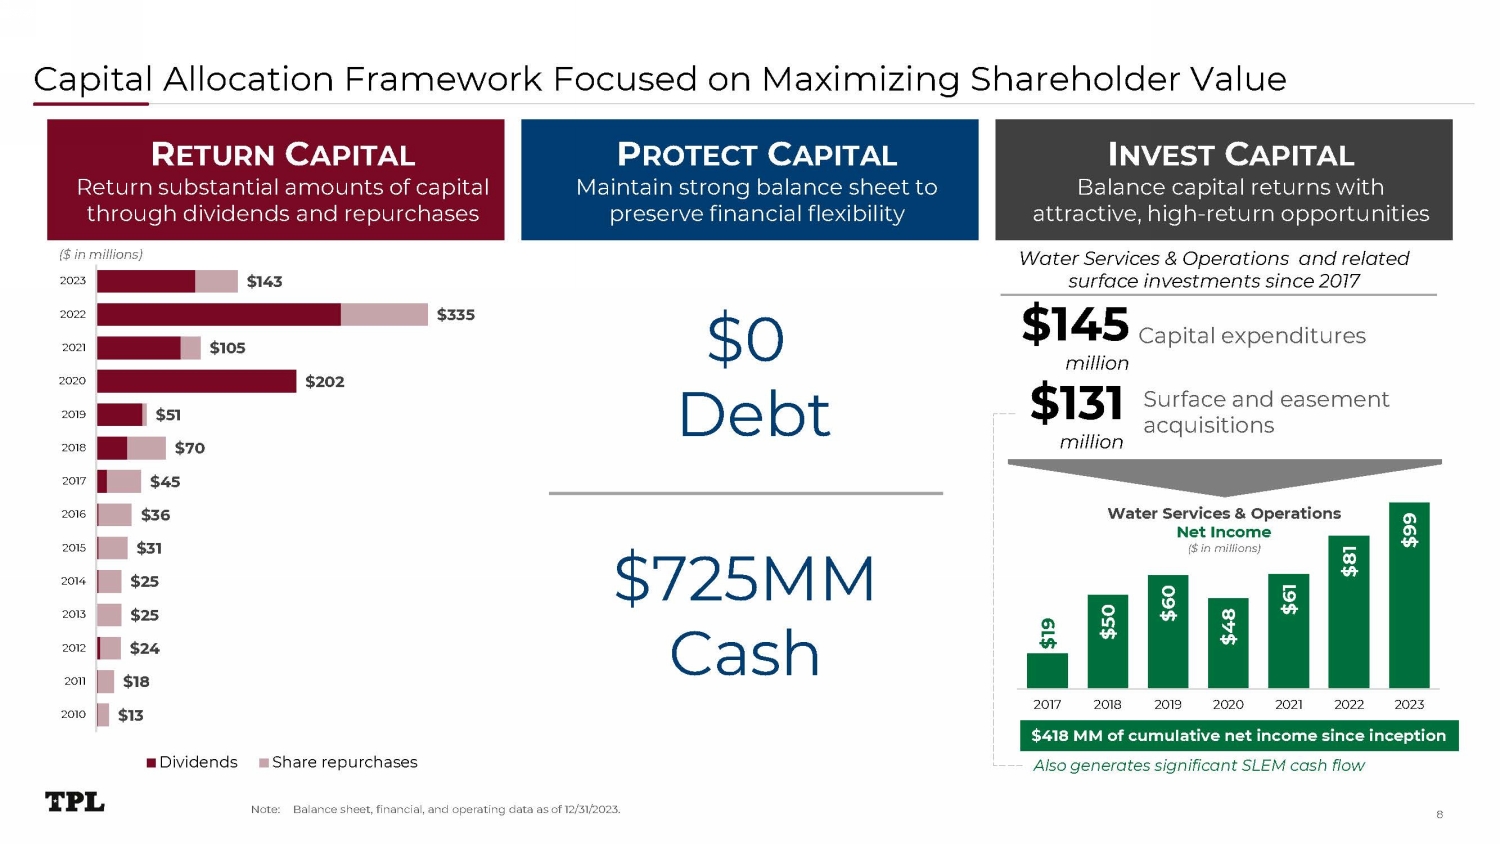
2015 $ 31 2014 $25 2013 $25 2012 $24 2011 $ 1 8 2010 $ 1 3 $ 36 $ 4 5 $ 7 0 $ 51 $2 0 2 $ 1 0 5 $ 335 $ 1 43 2 0 16 2 0 17 2 0 18 2 0 19 2 0 20 2 0 21 2 0 22 2 0 23 Dividends Share repurchases Capital Allocation Framework Focused on Maximizing Shareholder Value R ETURN C APITAL Return substantial amounts of capital through dividends and repurchases P ROTECT C APITAL Maintain strong balance sheet to preserve financial flexibility I NVEST C APITAL Balance capital returns with attractive, high - return opportunities $0 Deb t $ 72 5 MM Cash $ 19 $ 5 0 $60 $48 $61 $81 $99 2 01 7 2 01 8 2 01 9 202 0 20 2 1 20 2 2 20 23 $418 MM of cumulative net income since inception Surface and easement acquisitions Capital expenditures $ 1 45 m illio n $131 million Water Services & Operations and related surface investments since 2017 ($ in millions) Also generates significant SLEM cash flow Water Services & Operations Net Income ($ in millions) 8 Note: Balance sheet, financial, and operating data as of 12/31/2023.
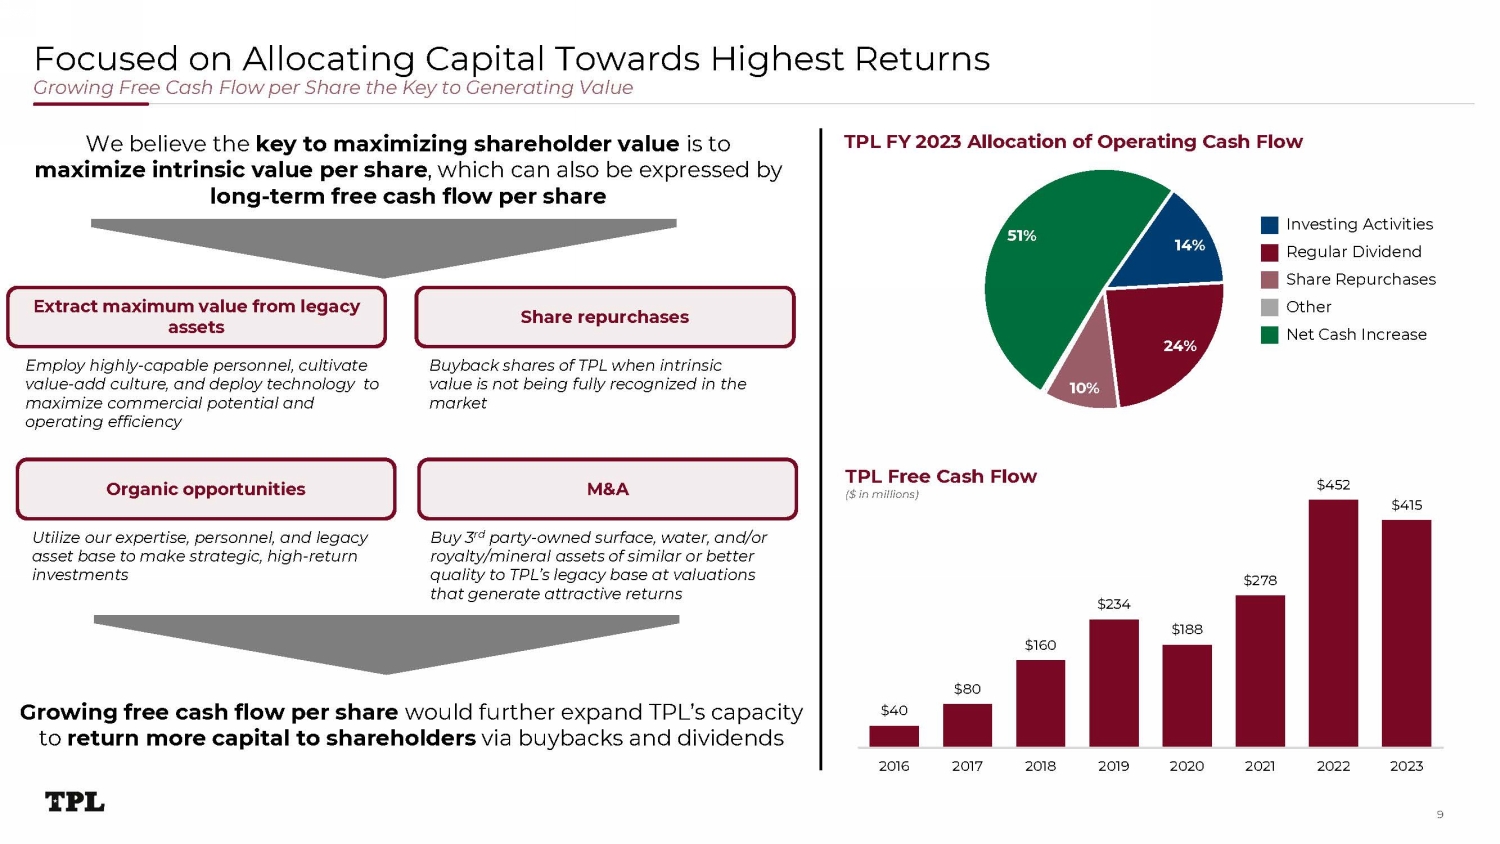
Focused on Allocating Capital Towards Highest Returns Growing Free Cash Flow per Share the Key to Generating Value Growing free cash flow per share would further expand TPL’s capacity to return more capital to shareholders via buybacks and dividends 1 4% 2 4% 1 0% 5 1 % Investing Activities Regular Dividend Share Repurchases Other Net Cash Increase We believe the key to maximizing shareholder value is to maximize intrinsic value per share , which can also be expressed by long - term free cash flow per share Extract maximum value from legacy assets TPL FY 2023 Allocation of Operating Cash Flow Share repurchases Organic opportunities M&A Employ highly - capable personnel, cultivate value - add culture, and deploy technology to maximize commercial potential and operating efficiency Buyback shares of TPL when intrinsic value is not being fully recognized in the market Buy 3 rd party - owned surface, water, and/or royalty/mineral assets of similar or better quality to TPL’s legacy base at valuations that generate attractive returns Utilize our expertise, personnel, and legacy asset base to make strategic, high - return investments $ 4 0 9 $1 6 0 $80 $ 2 34 $ 1 88 $ 2 78 $ 4 52 $ 4 1 5 2 0 1 6 2 0 1 7 2 0 1 8 2 0 1 9 2 0 20 2 0 21 2 0 22 2 0 23 TPL Free Cash Flow ($ in millions)
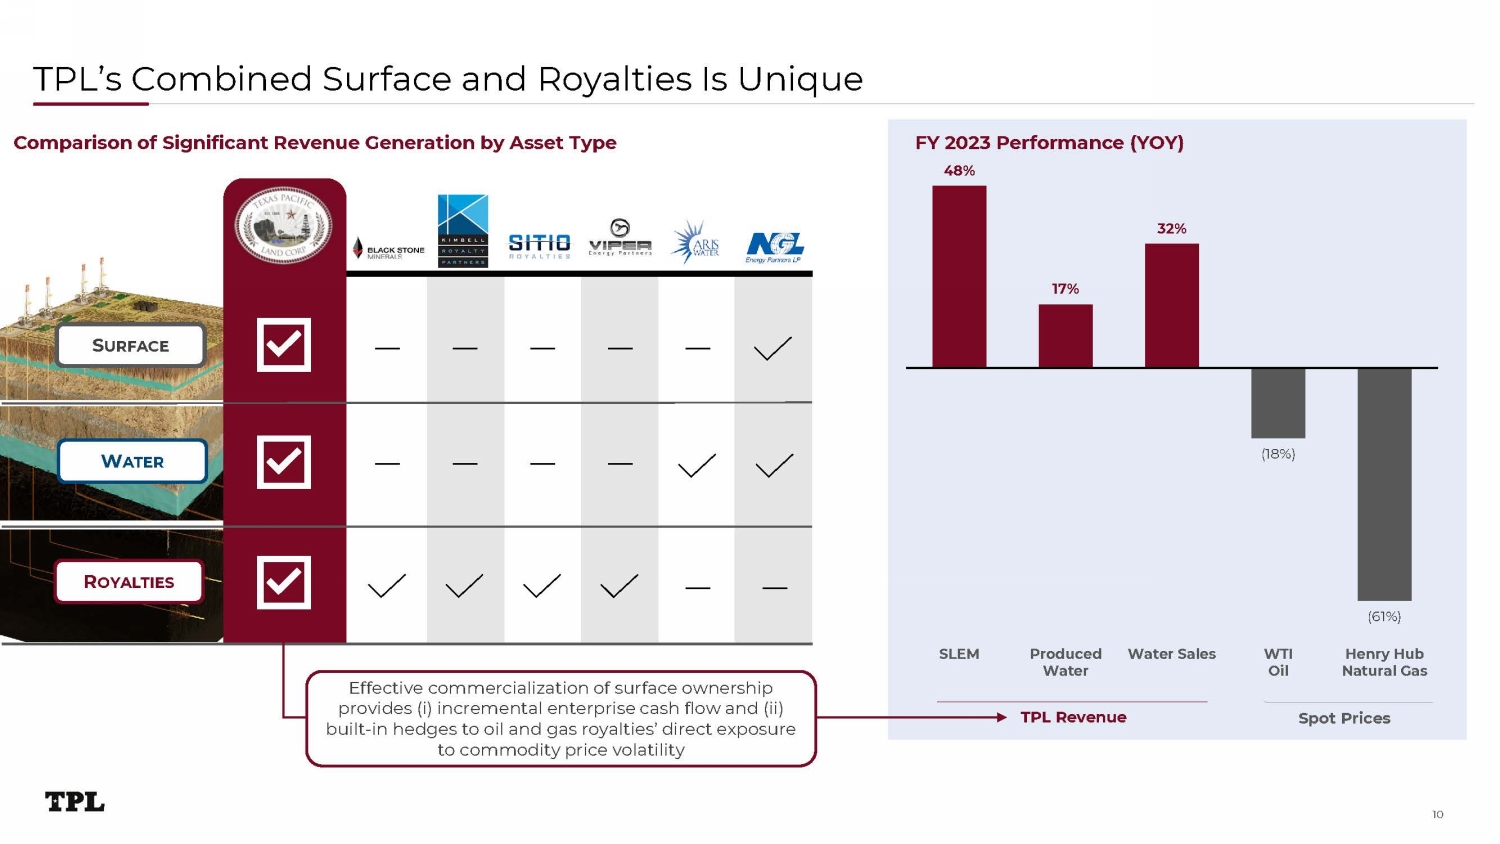
1 7 % 32 % ( 1 8 %) (6 1 % ) S LEM P ro d u c e d Water Water Sales W T I Oil Henry Hub Natural Gas TPL’s Combined Surface and Royalties Is Unique S U RF A C E W A T E R R OYALTIES FY 2023 Performance (YOY) 48% TPL Revenue Spot Prices — ― ― ― ― — ― ― ― — ― Comparison of Significant Revenue Generation by Asset Type Effective commercialization of surface ownership provides (i) incremental enterprise cash flow and (ii) built - in hedges to oil and gas royalties’ direct exposure to commodity price volatility 10
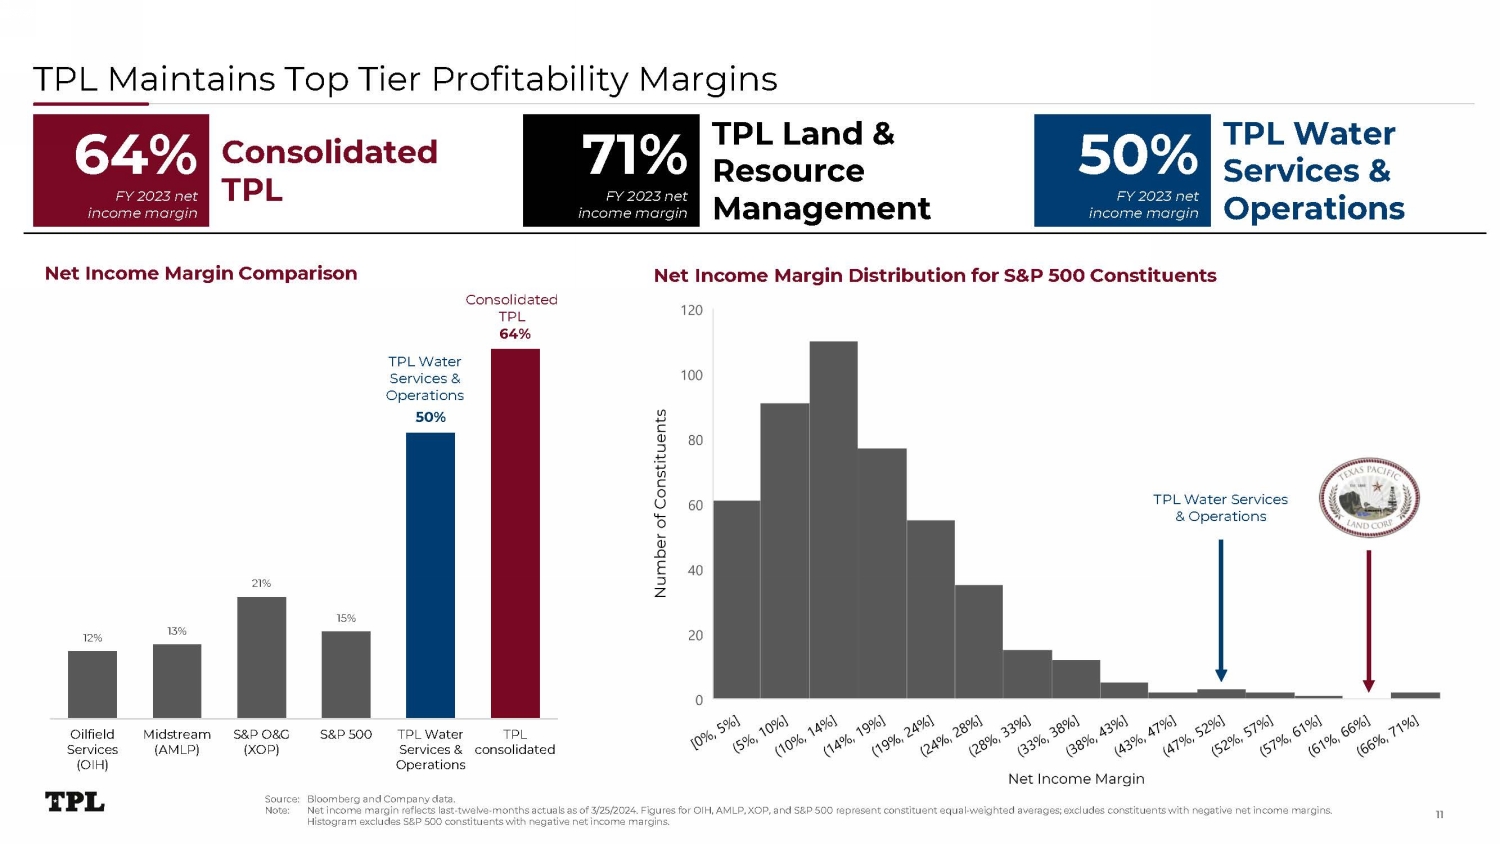
TPL Maintains Top Tier Profitability Margins 12% 13 % 21% 15 % C o n s o li d a t e d TPL 64% TPL Water Services & O p e r a t i o n s 50% Oilfield S e r v i c es (OIH) Mi d s t r e a m (AMLP) S&P O&G (XOP) S&P 500 TPL Water Services & O p e r a t i o n s TPL consolidated Net Income Margin Comparison Source: Bloomberg and Company data. Note: Net income margin reflects last - twelve - months actuals as of 3/25/2024. Figures for OIH, AMLP, XOP, and S&P 500 represent constituent equal - weighted averages; excludes constituents with negative net income margins. Histogram excludes S&P 500 constituents with negative net income margins. Net Income Margin Distribution for S&P 500 Constituents C on s oli d a t ed TPL 64% FY 2023 net income margin TPL Land & Resource M a na g em ent 71% FY 2023 net income margin TPL Water Services & O p e r a t ions 50% FY 2023 net income margin TPL Water Services & Operations 11
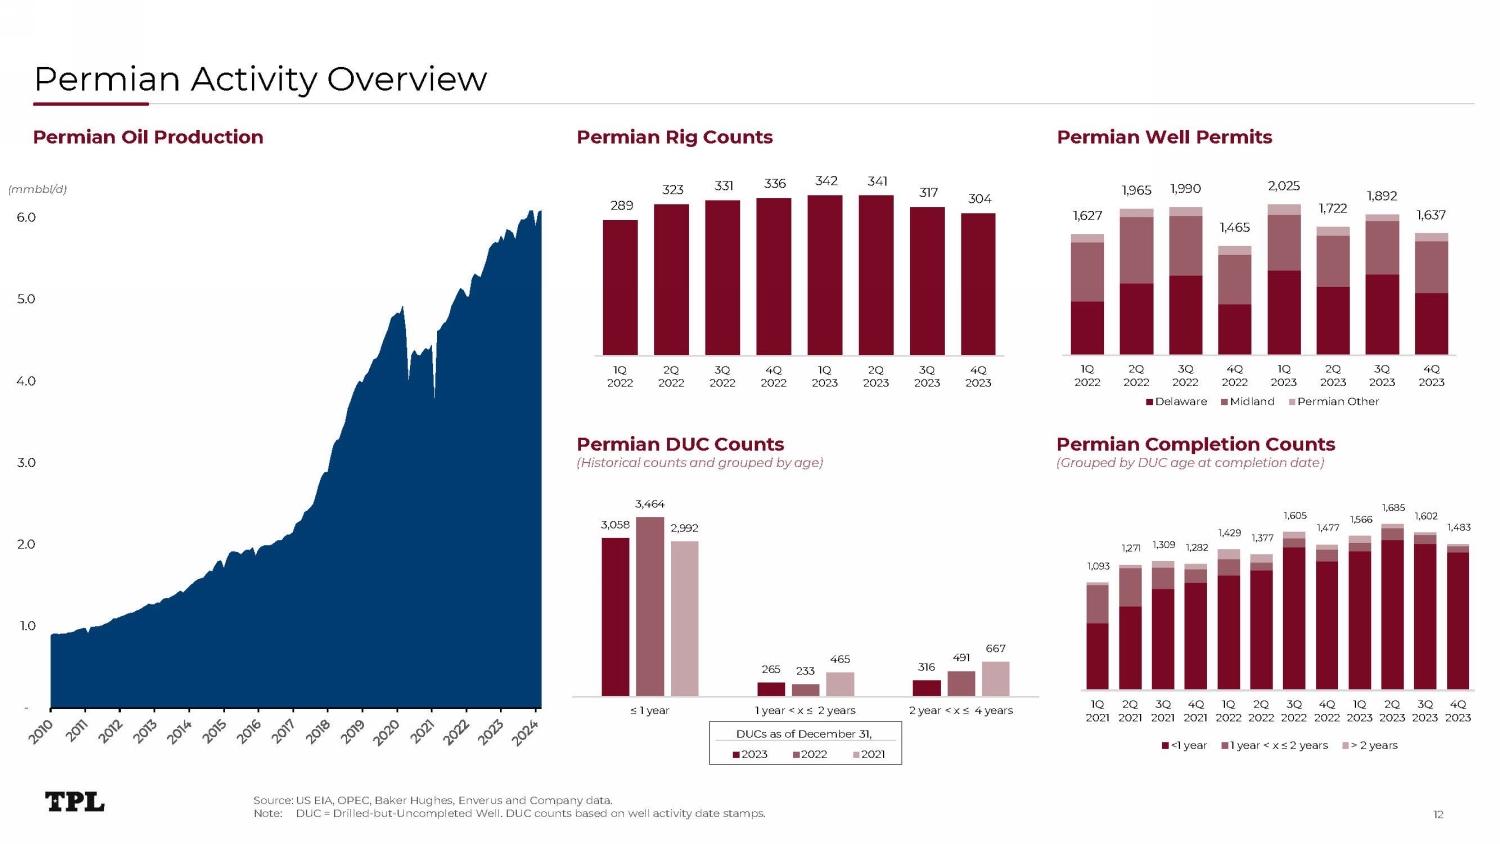
Permian Activity Overview 12 3 , 0 5 8 2 6 5 3 1 6 3 , 464 2 33 491 2 ,9 9 2 465 66 7 ≤ 1 year 1 year < x ≤ 2 years 2 year < x ≤ 4 years DUCs as of December 31, 2023 2022 2021 - 1 .0 2 .0 3 .0 4 .0 5 .0 6 .0 1,093 1 , 2 7 1 1,309 1,282 1,429 1,377 1 , 6 0 5 1 , 4 77 1 , 5 66 1 , 6 8 5 1 , 6 0 2 1 , 4 8 3 1Q 2Q 3Q 4Q 1Q 2Q 3Q 4Q 1Q 2Q 3Q 4Q 2021 2021 2021 2021 2022 2022 2022 2022 2023 2023 2023 2023 <1 year 1 year < x ≤ 2 years > 2 years 1,6 2 7 1,9 6 5 1,9 9 0 1,4 6 5 2,025 1, 7 2 2 1, 8 9 2 1,6 3 7 1Q 2Q 3Q 4Q 1Q 2Q 3Q 4Q 1Q 2Q 3Q 4Q 1Q 2Q 3Q 4Q 2022 2022 2022 2 0 22 2023 2023 2023 2023 2 0 22 2022 2022 Delaware 2022 M i d la 2023 2023 nd Permian O 2023 ther 2023 Permian Well Permits Permian Rig Counts Permian Oil Production Permian Completion Counts (Grouped by DUC age at completion date) (mmbbl/d) 2 8 9 3 2 3 331 336 3 42 3 41 3 1 7 3 04 Permian DUC Counts (Historical counts and grouped by age) Source: US EIA, OPEC, Baker Hughes, Enverus and Company data. Note: DUC = Drilled - but - Uncompleted Well. DUC counts based on well activity date stamps.
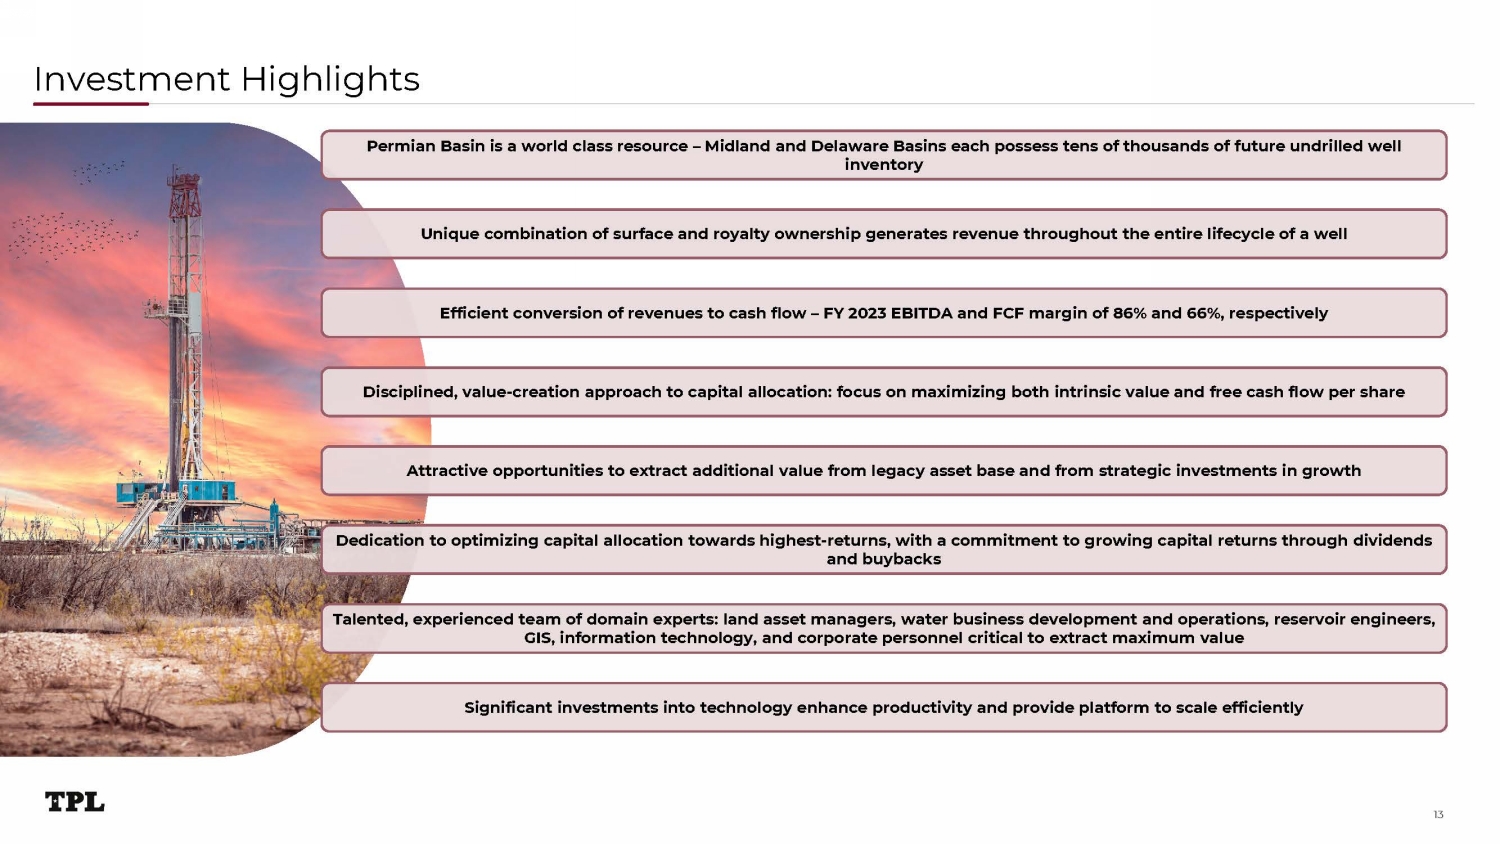
Investment Highlights 13 Permian Basin is a world class resource – Midland and Delaware Basins each possess tens of thousands of future undrilled well inventory Unique combination of surface and royalty ownership generates revenue throughout the entire lifecycle of a well Disciplined, value - creation approach to capital allocation: focus on maximizing both intrinsic value and free cash flow per share Efficient conversion of revenues to cash flow – FY 2023 EBITDA and FCF margin of 86% and 66%, respectively Significant investments into technology enhance productivity and provide platform to scale efficiently Attractive opportunities to extract additional value from legacy asset base and from strategic investments in growth Dedication to optimizing capital allocation towards highest - returns, with a commitment to growing capital returns through dividends and buybacks Talented, experienced team of domain experts: land asset managers, water business development and operations, reservoir engineers, GIS, information technology, and corporate personnel critical to extract maximum value
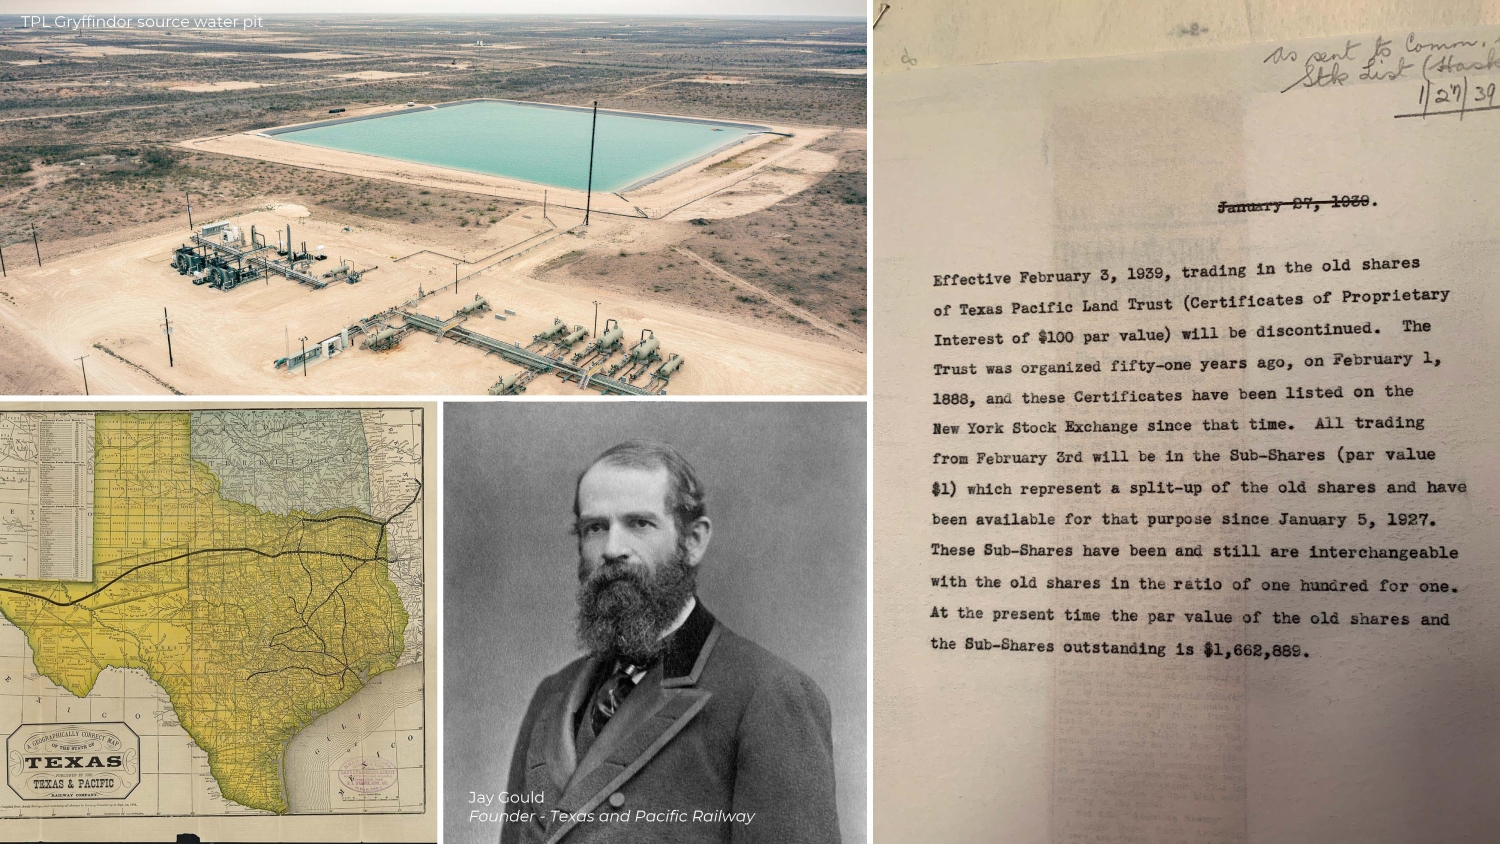
Jay Gould Founder - Texas and Pacific Railway 14 TPL Gryffindor source water pit
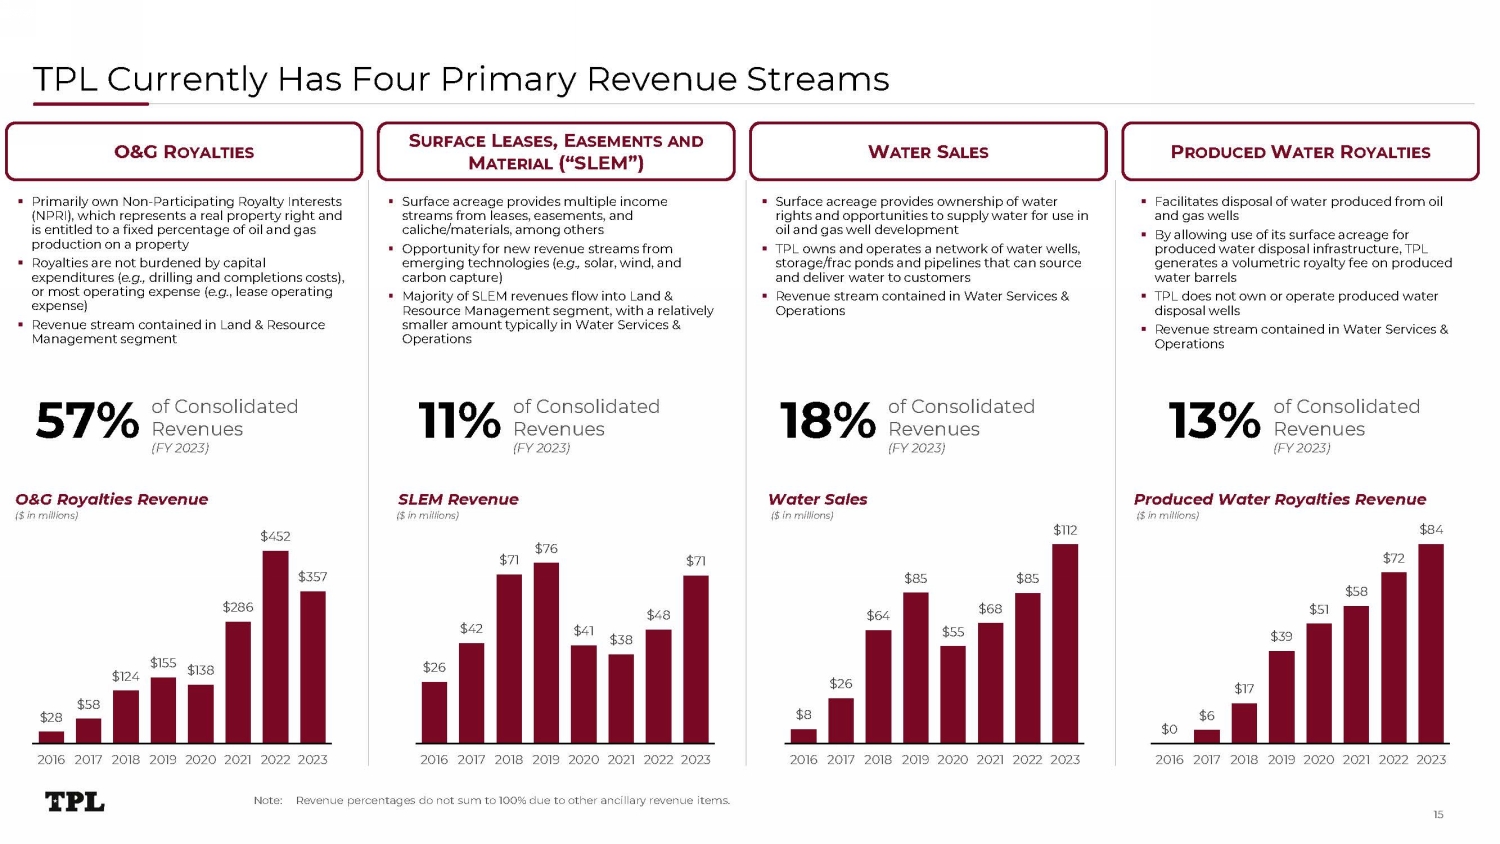
TPL Currently Has Four Primary Revenue Streams ▪ Primarily own Non - Participating Royalty Interests (NPRI), which represents a real property right and is entitled to a fixed percentage of oil and gas production on a property ▪ Royalties are not burdened by capital expenditures ( e.g., drilling and completions costs), or most operating expense ( e.g. , lease operating expense) ▪ Revenue stream contained in Land & Resource Management segment ▪ Surface acreage provides multiple income streams from leases, easements, and caliche/materials, among others ▪ Opportunity for new revenue streams from emerging technologies ( e.g., solar, wind, and carbon capture) ▪ Majority of SLEM revenues flow into Land & Resource Management segment, with a relatively smaller amount typically in Water Services & Operations ▪ Facilitates disposal of water produced from oil and gas wells ▪ By allowing use of its surface acreage for produced water disposal infrastructure, TPL generates a volumetric royalty fee on produced water barrels ▪ TPL does not own or operate produced water disposal wells ▪ Revenue stream contained in Water Services & Operations $2 8 $ 5 8 $155 $138 $124 $2 8 6 $4 5 2 $ 3 5 7 2016 2017 2018 2019 2020 2021 2022 2023 O&G R OYALTIES S URFACE L EASES , E ASEMENTS AND M ATERIAL (“SLEM”) W ATER S ALES P RODUCED W ATER R OYALTIES ▪ Surface acreage provides ownership of water rights and opportunities to supply water for use in oil and gas well development ▪ TPL owns and operates a network of water wells, storage/frac ponds and pipelines that can source and deliver water to customers ▪ Revenue stream contained in Water Services & Operations $2 6 $42 $ 71 $ 76 $ 41 $ 3 8 $ 48 $ 71 2016 2017 2018 2019 2020 2021 2022 2023 SLEM Revenue ($ in millions) $8 $2 6 $ 6 4 $ 8 5 $ 5 5 $ 6 8 $ 8 5 $112 2016 2017 2018 2019 2020 2021 2022 2023 $0 $6 $17 $ 3 9 $ 5 1 $ 5 8 $ 72 Produced Water Royalties Revenue ($ in millions) $ 8 4 2016 2017 2018 2019 2020 2021 2022 2023 of Consolidated Revenues (FY 2023) 5 7 % Note: Revenue percentages do not sum to 100% due to other ancillary revenue items. of Consolidated Revenues (FY 2023) 11% of Consolidated Revenues (FY 2023) of Consolidated Revenues (FY 2023) 1 3% O&G Royalties Revenue ($ in millions) 1 8% Water Sales ($ in millions) 15
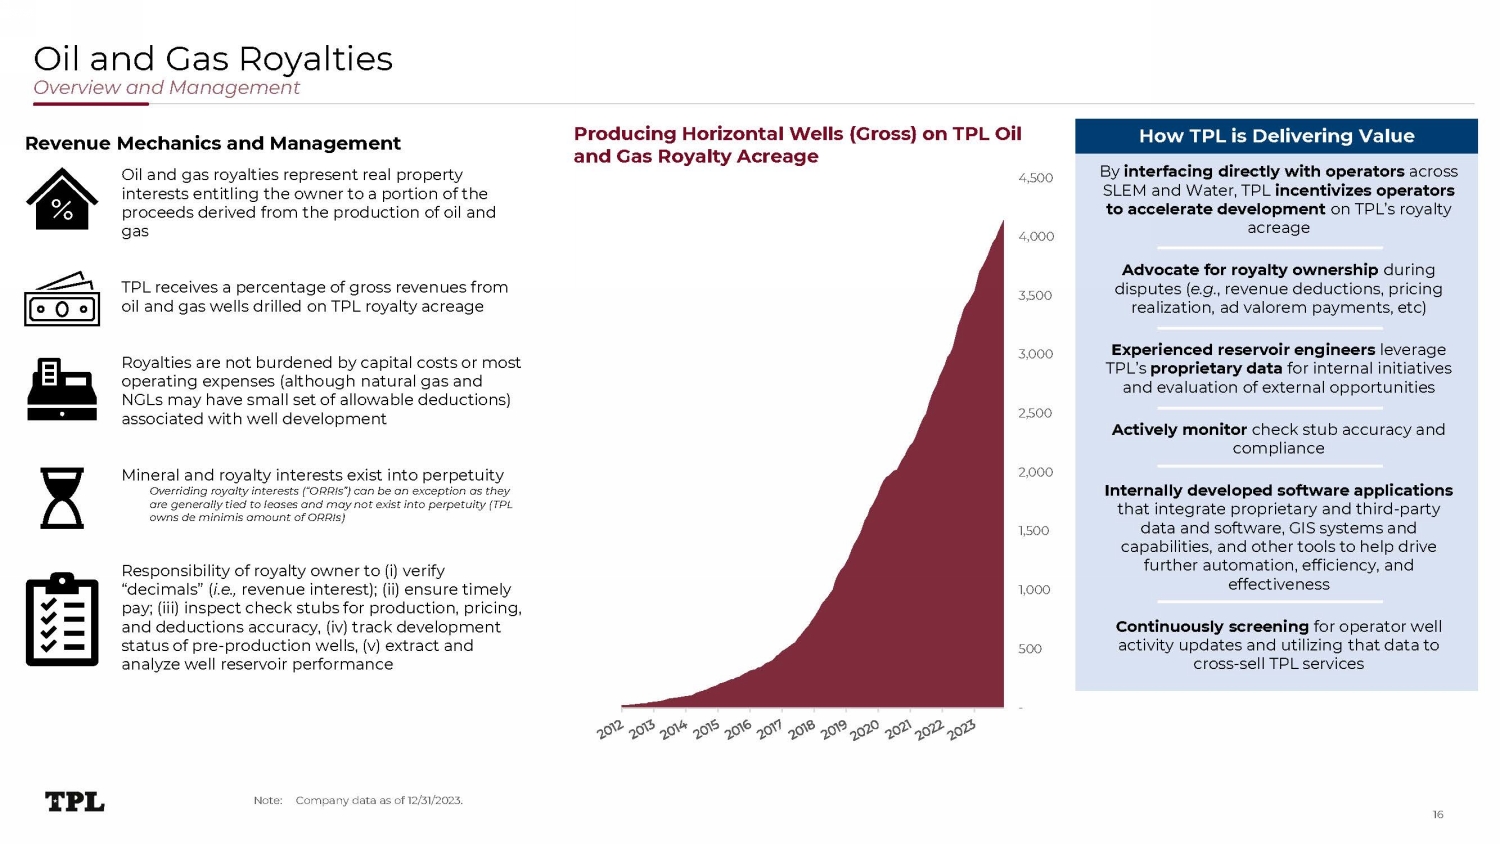
Oil and Gas Royalties Overview and Management - 5 00 1 , 000 1,500 2 , 0 00 2 , 5 00 3 , 000 3 , 5 00 4 , 000 Producing Horizontal Wells (Gross) on TPL Oil and Gas Royalty Acreage 4 , 5 0 0 By interfacing directly with operators across SLEM and Water, TPL incentivizes operators to accelerate development on TPL’s royalty acreage Advocate for royalty ownership during disputes ( e.g. , revenue deductions, pricing realization, ad valorem payments, etc) Experienced reservoir engineers leverage TPL’s proprietary data for internal initiatives and evaluation of external opportunities Actively monitor check stub accuracy and compliance Internally developed software applications that integrate proprietary and third - party data and software, GIS systems and capabilities, and other tools to help drive further automation, efficiency, and effectiveness Continuously screening for operator well activity updates and utilizing that data to cross - sell TPL services How TPL is Delivering Value Revenue Mechanics and Management Oil and gas royalties represent real property interests entitling the owner to a portion of the proceeds derived from the production of oil and gas TPL receives a percentage of gross revenues from oil and gas wells drilled on TPL royalty acreage Royalties are not burdened by capital costs or most operating expenses (although natural gas and NGLs may have small set of allowable deductions) associated with well development Mineral and royalty interests exist into perpetuity Overriding royalty interests (“ORRIs”) can be an exception as they are generally tied to leases and may not exist into perpetuity (TPL owns de minimis amount of ORRIs) Responsibility of royalty owner to (i) verify “decimals” ( i.e., revenue interest); (ii) ensure timely pay; (iii) inspect check stubs for production, pricing, and deductions accuracy, (iv) track development status of pre - production wells, (v) extract and analyze well reservoir performance Note: Company data as of 12/31/2023. 16
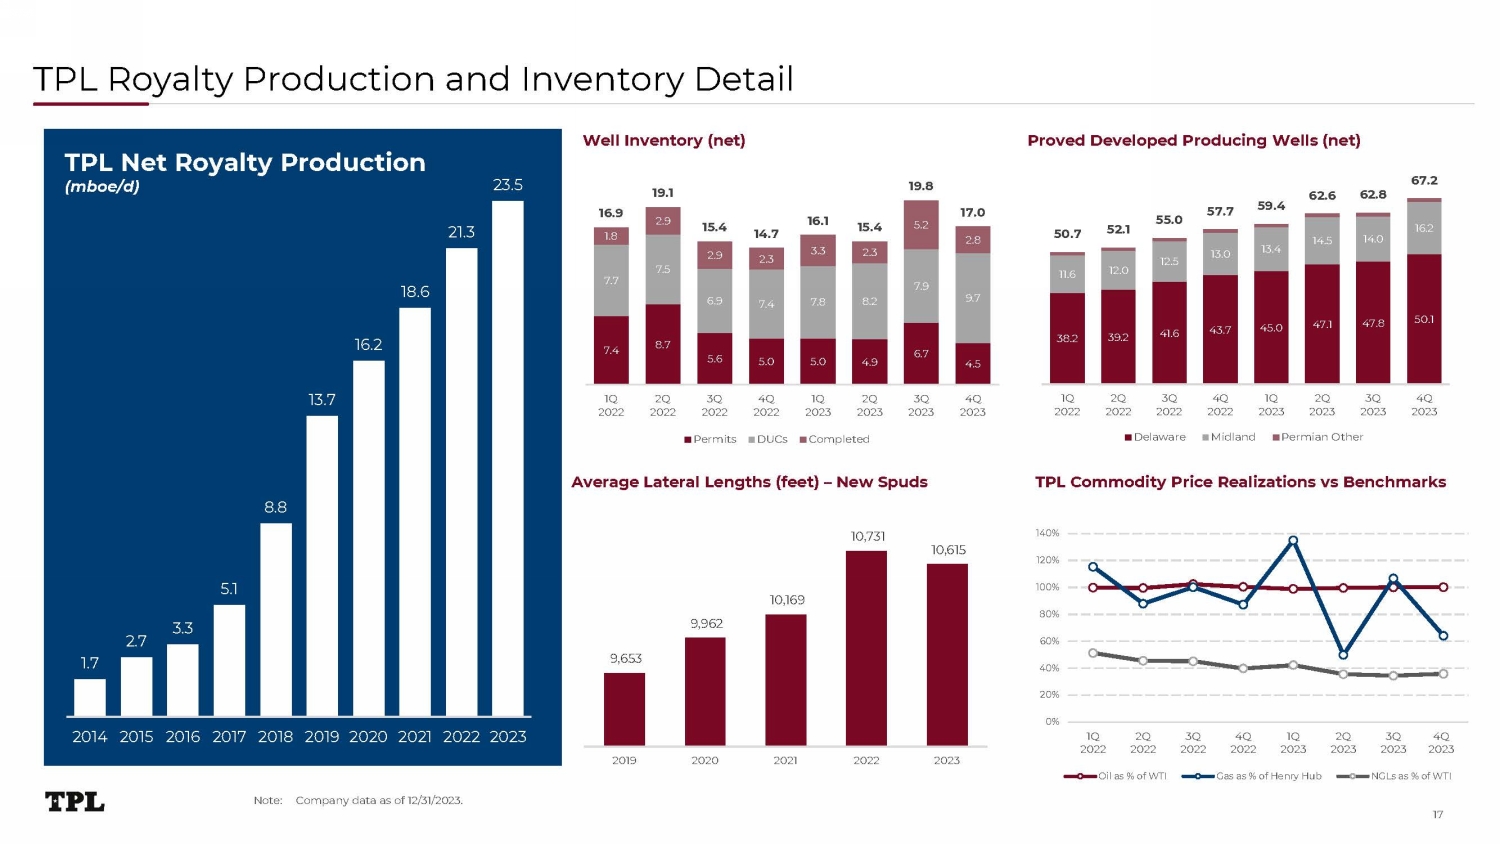
TPL Royalty Production and Inventory Detail 20% 0% 40% 140 % 12 0 % 100% 8 0% 6 0 % 1Q 2 0 22 2Q 2 0 22 3Q 2 0 22 4Q 2 0 22 1Q 2 0 23 2Q 2 0 23 3Q 4Q 2 0 23 2 0 23 Oil as % of WTI Gas as % of Henry Hub NGLs as % of WTI 7 . 4 8 .7 5 .6 5 . 0 5 . 0 4 .9 6 .7 4. 5 7. 7 7 .5 6 .9 7 . 4 7 .8 8 .2 7 . 9 9 .7 1 .8 2 .9 2 .9 2 .3 3 . 3 2 .3 5 .2 2 .8 1 6 . 9 1 9 . 1 1 5 . 4 1 4 .7 1 6 . 1 1 5 . 4 1 9 . 8 1 7.0 1Q 2 0 22 2Q 2 0 22 3Q 2 0 22 4Q 2 0 22 1Q 2 0 23 2Q 2 0 23 3Q 2 0 23 4Q 2 0 23 P e r m i t s D UC s Completed 1 . 7 2. 7 3. 3 5. 1 8. 8 1 3 . 7 1 6 . 2 1 8. 6 2 1. 3 2 3 . 5 2014 2015 2016 2017 2018 2019 2020 2021 2022 2023 TPL Net Royalty Production (mboe/d) Well Inventory (net) Proved Developed Producing Wells (net) Average Lateral Lengths (feet) – New Spuds TPL Commodity Price Realizations vs Benchmarks 9 , 65 3 9 , 962 10 ,16 9 10,731 10 , 6 15 2019 2020 2021 2022 2023 38.2 39.2 41.6 43.7 45.0 47.1 47.8 50.1 11.6 12.0 12.5 13.0 13.4 14.5 14.0 16.2 5 0 . 7 5 2.1 55 . 0 5 7.7 59 . 4 6 2. 6 6 2.8 6 7.2 1Q 2 0 22 2Q 2 0 22 3Q 2 0 22 4Q 2 0 22 1Q 2 0 23 2Q 2 0 23 3Q 2 0 23 4Q 2 0 23 D e l a w a r e M i d l a n d Permian Other Note: Company data as of 12/31/2023. 17

TPL source water infrastructure 18
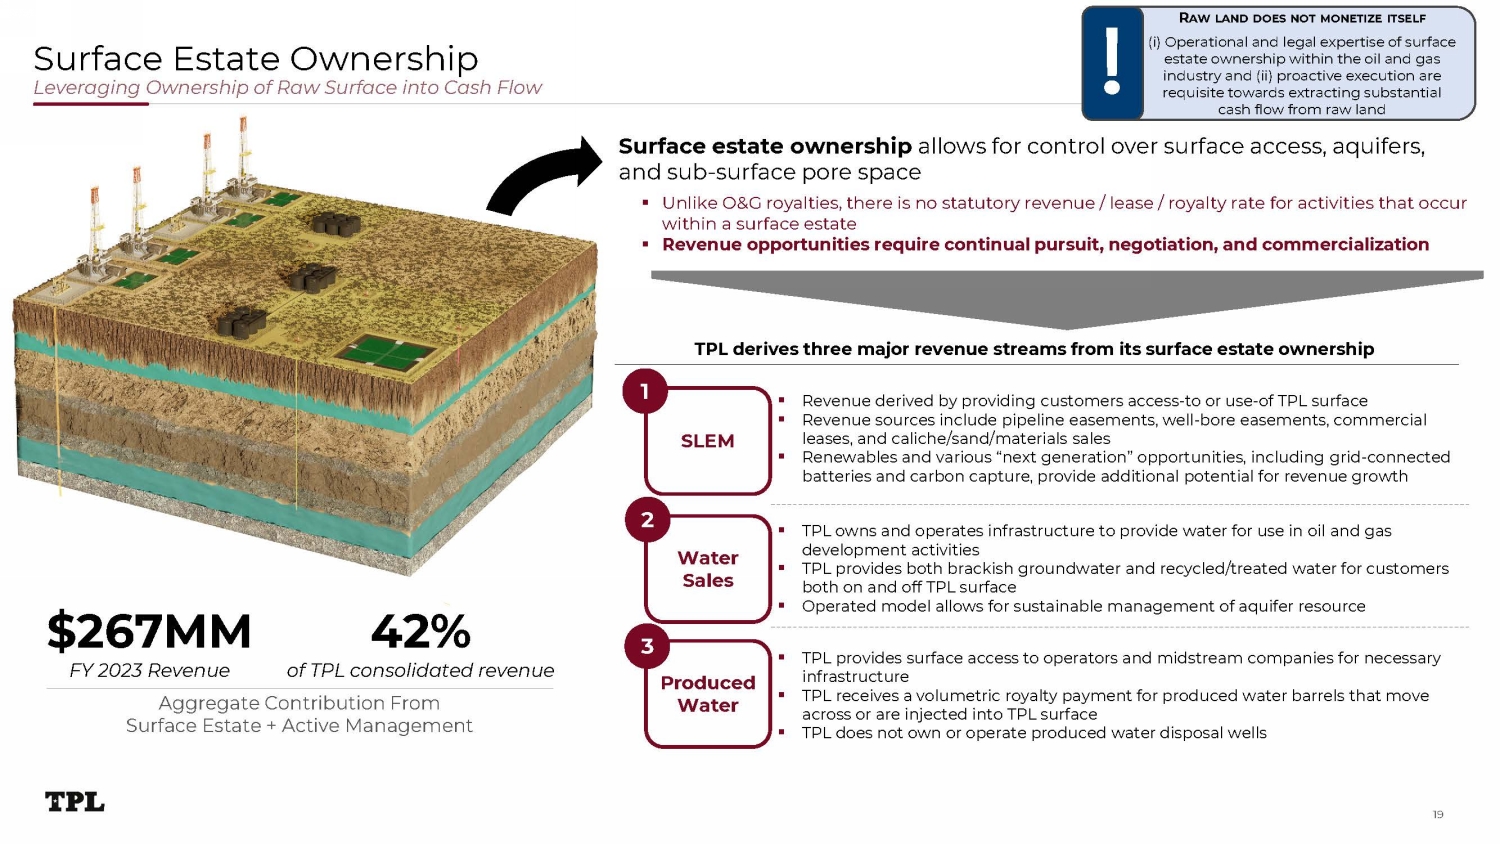
R AW LAND DOES NOT MONETIZE ITSELF (i) Operational and legal expertise of surface estate ownership within the oil and gas industry and (ii) proactive execution are requisite towards extracting substantial cash flow from raw land Surface Estate Ownership Leveraging Ownership of Raw Surface into Cash Flow Surface estate ownership allows for control over surface access, aquifers, and sub - surface pore space ▪ Unlike O&G royalties, there is no statutory revenue / lease / royalty rate for activities that occur within a surface estate ▪ Revenue opportunities require continual pursuit, negotiation, and commercialization $2 67 MM FY 2023 Revenue 42% of TPL consolidated revenue TPL derives three major revenue streams from its surface estate ownership S LE M W a t er Sales Pr o d u c e d Water ▪ Revenue derived by providing customers access - to or use - of TPL surface ▪ Revenue sources include pipeline easements, well - bore easements, commercial leases, and caliche/sand/materials sales ▪ Renewables and various “next generation” opportunities, including grid - connected batteries and carbon capture, provide additional potential for revenue growth ▪ TPL owns and operates infrastructure to provide water for use in oil and gas development activities ▪ TPL provides both brackish groundwater and recycled/treated water for customers both on and off TPL surface ▪ Operated model allows for sustainable management of aquifer resource ▪ TPL provides surface access to operators and midstream companies for necessary infrastructure ▪ TPL receives a volumetric royalty payment for produced water barrels that move across or are injected into TPL surface ▪ TPL does not own or operate produced water disposal wells 1 2 3 Aggregate Contribution From Surface Estate + Active Management 19
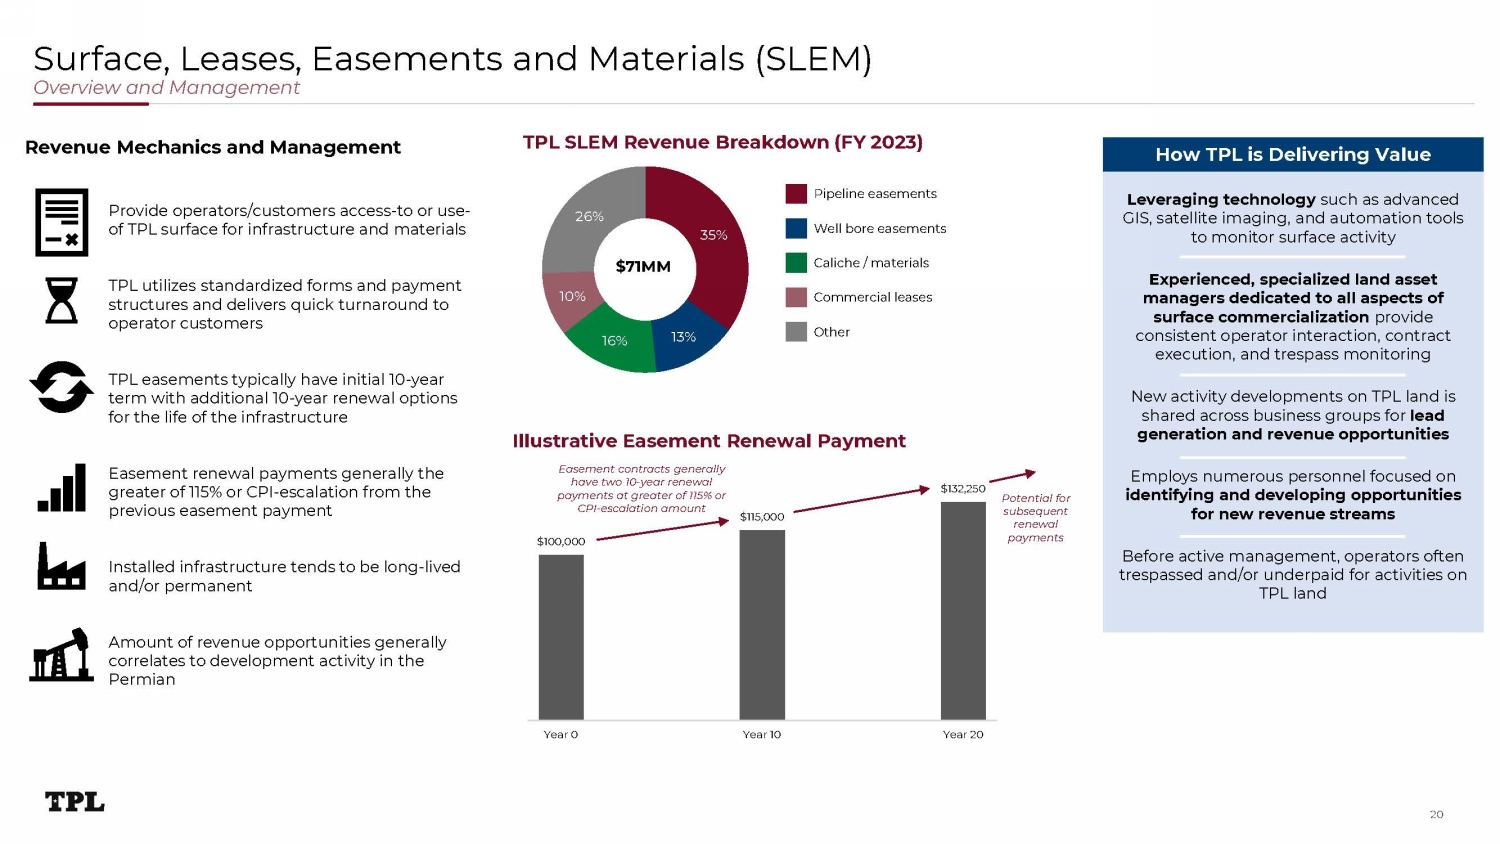
3 5% 1 3% 1 6 % 1 0 % 2 6% $ 1 00, 000 Illustrative Easement Renewal Payment Easement contracts generally have two 10 - year renewal payments at greater of 115% or CPI - escalation amount $115,000 $ 13 2 , 25 0 Year 0 Year 10 Year 20 Surface, Leases, Easements and Materials (SLEM) Overview and Management $ 7 1 M M Pipeline easements Caliche / materials Commercial leases Well bore easements Oth e r Provide operators/customers access - to or use - of TPL surface for infrastructure and materials TPL utilizes standardized forms and payment structures and delivers quick turnaround to operator customers TPL easements typically have initial 10 - year term with additional 10 - year renewal options for the life of the infrastructure Easement renewal payments generally the greater of 115% or CPI - escalation from the previous easement payment Installed infrastructure tends to be long - lived and/or permanent Amount of revenue opportunities generally correlates to development activity in the Permian Leveraging technology such as advanced GIS, satellite imaging, and automation tools to monitor surface activity Experienced, specialized land asset managers dedicated to all aspects of surface commercialization provide consistent operator interaction, contract execution, and trespass monitoring New activity developments on TPL land is shared across business groups for lead generation and revenue opportunities Employs numerous personnel focused on identifying and developing opportunities for new revenue streams Before active management, operators often trespassed and/or underpaid for activities on TPL land How TPL is Delivering Value TPL SLEM Revenue Breakdown (FY 2023) Revenue Mechanics and Management Potential for subsequent renewal payments 20
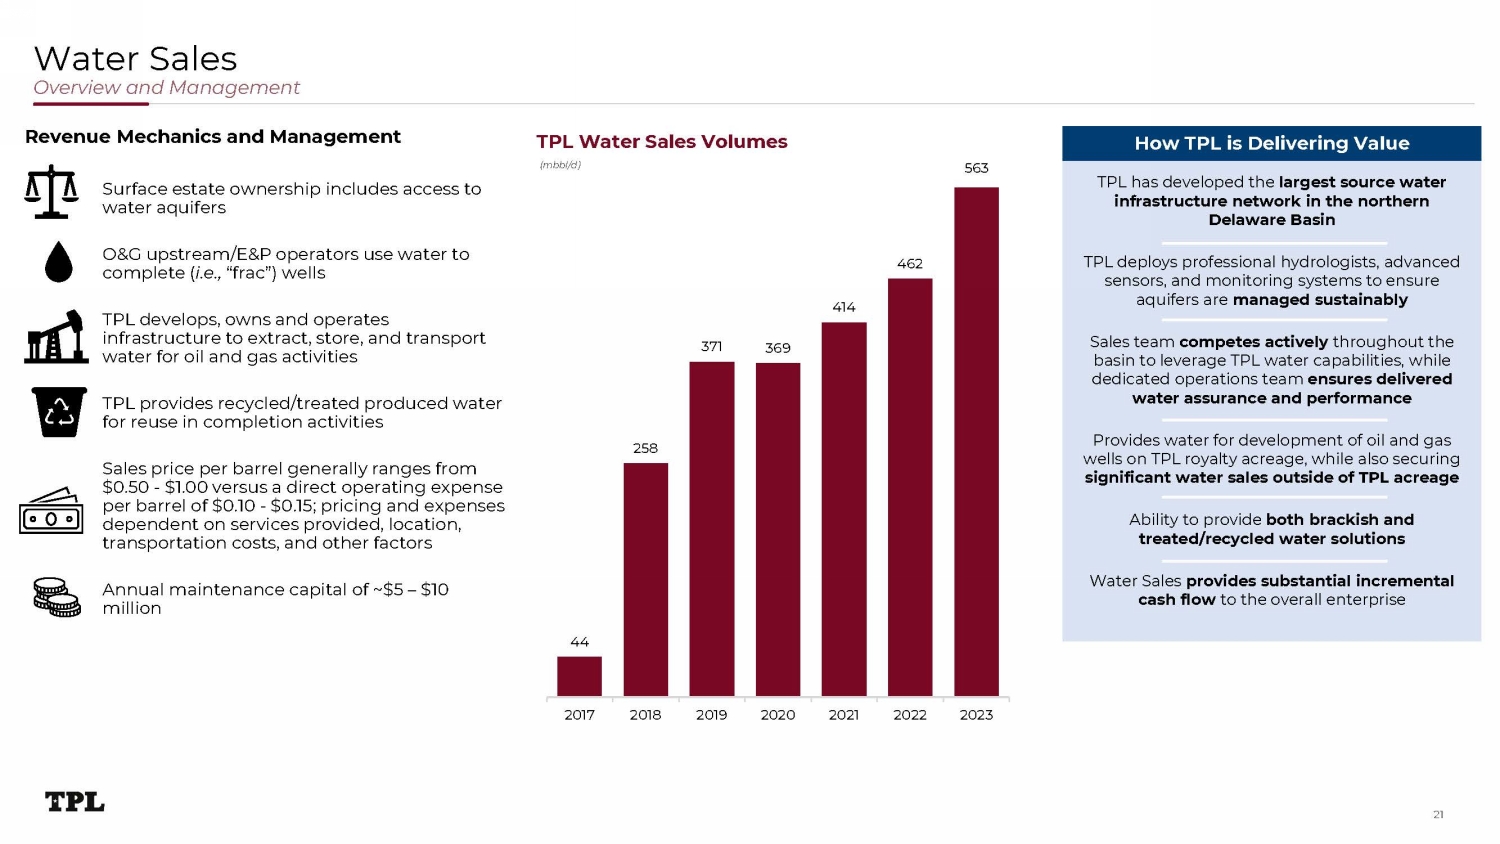
TPL has developed the largest source water infrastructure network in the northern Delaware Basin TPL deploys professional hydrologists, advanced sensors, and monitoring systems to ensure aquifers are managed sustainably Sales team competes actively throughout the basin to leverage TPL water capabilities, while dedicated operations team ensures delivered water assurance and performance Provides water for development of oil and gas wells on TPL royalty acreage, while also securing significant water sales outside of TPL acreage Ability to provide both brackish and treated/recycled water solutions Water Sales provides substantial incremental cash flow to the overall enterprise Water Sales Overview and Management 44 2 58 37 1 3 69 4 1 4 4 62 5 6 3 2 0 1 7 2 0 1 8 2 0 1 9 2 0 20 2 0 21 2 0 22 2 0 23 Surface estate ownership includes access to water aquifers O&G upstream/E&P operators use water to complete ( i.e., “frac”) wells TPL develops, owns and operates infrastructure to extract, store, and transport water for oil and gas activities TPL provides recycled/treated produced water for reuse in completion activities Sales price per barrel generally ranges from $0.50 - $1.00 versus a direct operating expense per barrel of $0.10 - $0.15; pricing and expenses dependent on services provided, location, transportation costs, and other factors Annual maintenance capital of ~$5 – $10 million How TPL is Delivering Value TPL Water Sales Volumes (mbbl/d) Revenue Mechanics and Management 21
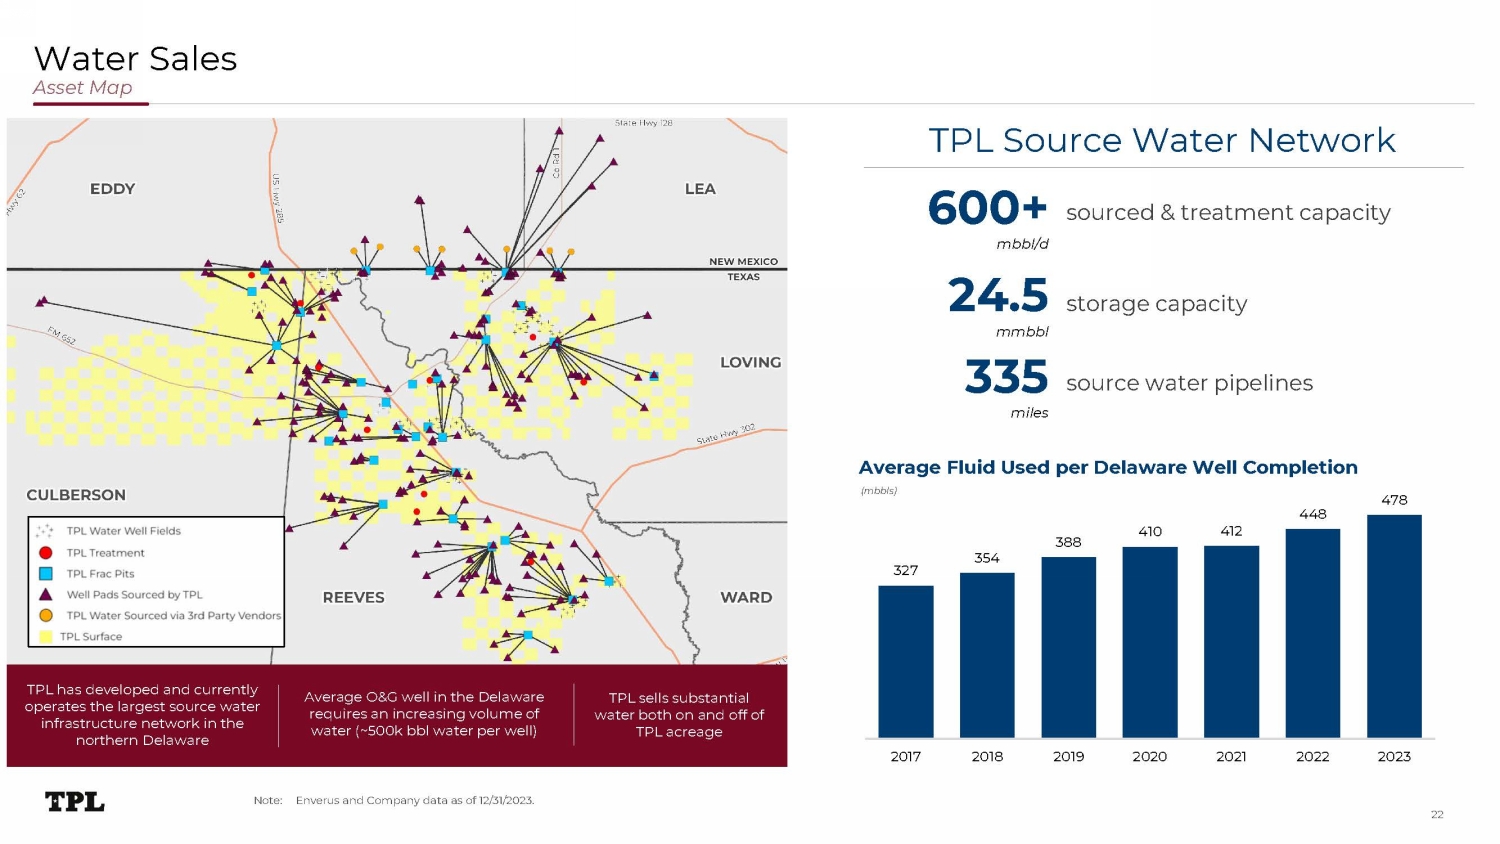
Water Sales Asset Map 24.5 storage capacity mmbbl 6 00+ m bb l/d source water pipelines 335 m ile s 3 54 327 3 88 4 1 0 4 12 Average Fluid Used per Delaware Well Completion (mbbls) 448 4 78 2 0 1 7 2 0 1 8 2 0 1 9 2 0 20 2 0 21 2 0 22 2 0 23 Average O&G well in the Delaware requires an increasing volume of water (~500k bbl water per well) TPL has developed and currently operates the largest source water infrastructure network in the northern Delaware TPL sells substantial water both on and off of TPL acreage TPL Source Water Network N o t e : 22 Enverus and Company data as of 12/31/2023. sourced & treatment capacity
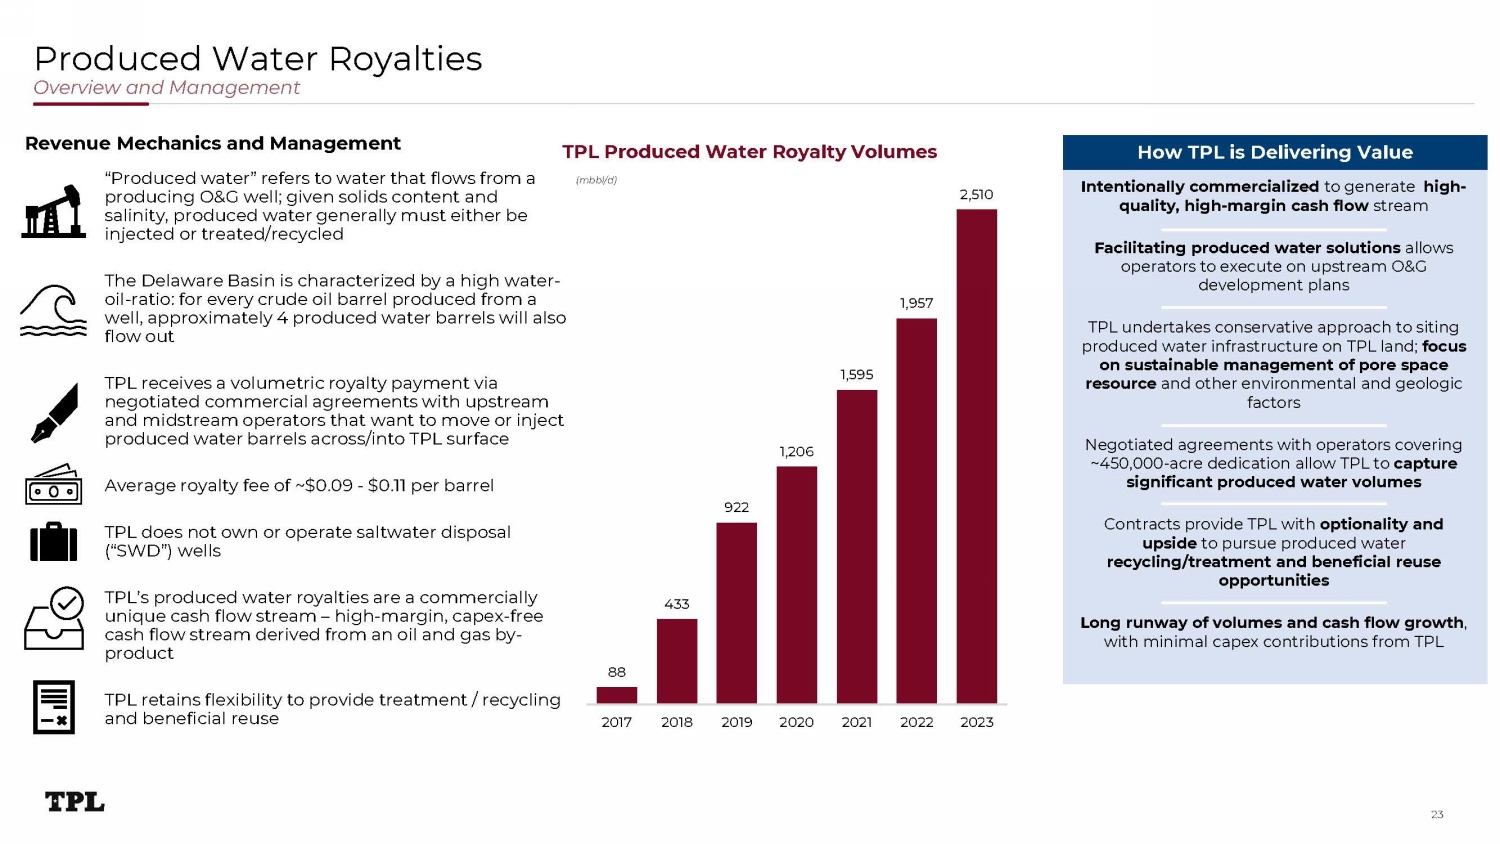
Intentionally commercialized to generate high - quality, high - margin cash flow stream Facilitating produced water solutions allows operators to execute on upstream O&G development plans TPL undertakes conservative approach to siting produced water infrastructure on TPL land; focus on sustainable management of pore space resource and other environmental and geologic factors Negotiated agreements with operators covering ~450,000 - acre dedication allow TPL to capture significant produced water volumes Contracts provide TPL with optionality and upside to pursue produced water recycling/treatment and beneficial reuse opportunities Long runway of volumes and cash flow growth , with minimal capex contributions from TPL Produced Water Royalties Overview and Management 88 4 33 9 22 1 , 206 1 , 5 9 5 1 , 9 57 2, 5 1 0 2017 2018 2019 2020 2021 2022 2023 Revenue Mechanics and Management “Produced water” refers to water that flows from a producing O&G well; given solids content and salinity, produced water generally must either be injected or treated/recycled The Delaware Basin is characterized by a high water - oil - ratio: for every crude oil barrel produced from a well, approximately 4 produced water barrels will also flow out TPL receives a volumetric royalty payment via negotiated commercial agreements with upstream and midstream operators that want to move or inject produced water barrels across/into TPL surface Average royalty fee of ~$0.09 - $0.11 per barrel TPL does not own or operate saltwater disposal (“SWD”) wells TPL’s produced water royalties are a commercially unique cash flow stream – high - margin, capex - free cash flow stream derived from an oil and gas by - product TPL retains flexibility to provide treatment / recycling and beneficial reuse How TPL is Delivering Value TPL Produced Water Royalty Volumes (mbbl/d) 23
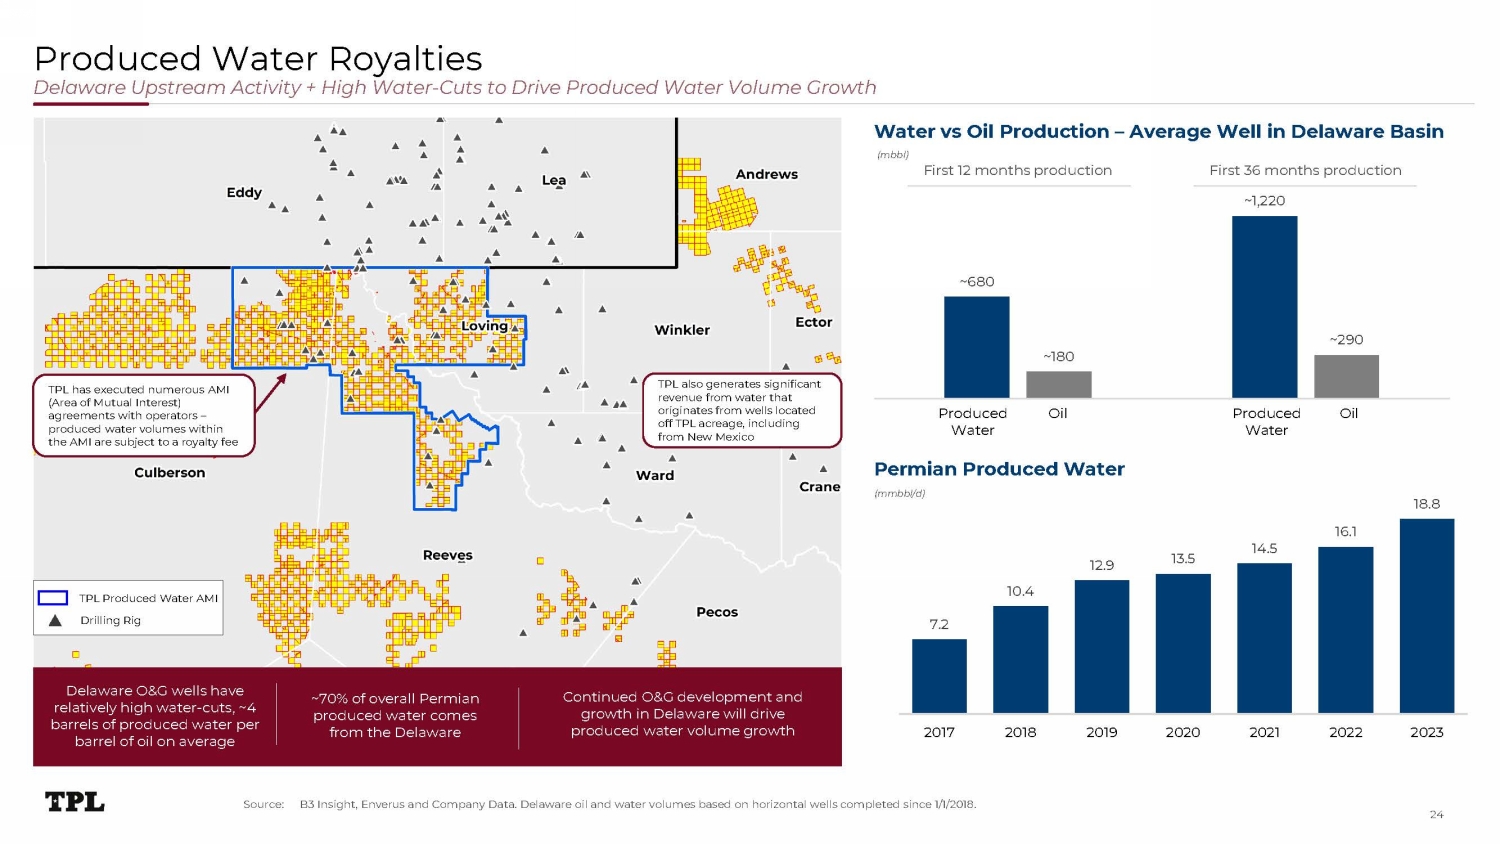
~ 6 8 0 ~1 8 0 ~ 29 0 7 . 2 1 0 . 4 1 2. 9 1 3 . 5 1 4 . 5 1 8. 8 16.1 2 0 1 7 2 0 1 8 2 0 1 9 2 0 20 2 0 21 2 0 22 2 0 23 Produced Water Royalties Permian Produced Water (mmbbl/d) ~70% of overall Permian produced water comes from the Delaware Continued O&G development and growth in Delaware will drive produced water volume growth Delaware Upstream Activity + High Water - Cuts to Drive Produced Water Volume Growth Water vs Oil Production – Average Well in Delaware Basin (mbbl) First 12 months production First 36 months production ~ 1 , 220 P r o d u c e d O il Water P r o d u c e d O il Water Delaware O&G wells have relatively high water - cuts, ~4 barrels of produced water per barrel of oil on average TPL Produced Water AMI Drilling Rig TPL has executed numerous AMI (Area of Mutual Interest) agreements with operators – produced water volumes within the AMI are subject to a royalty fee Source: B3 Insight, Enverus and Company Data. Delaware oil and water volumes based on horizontal wells completed since 1/1/2018. TPL also generates significant revenue from water that originates from wells located off TPL acreage, including from New Mexico 24
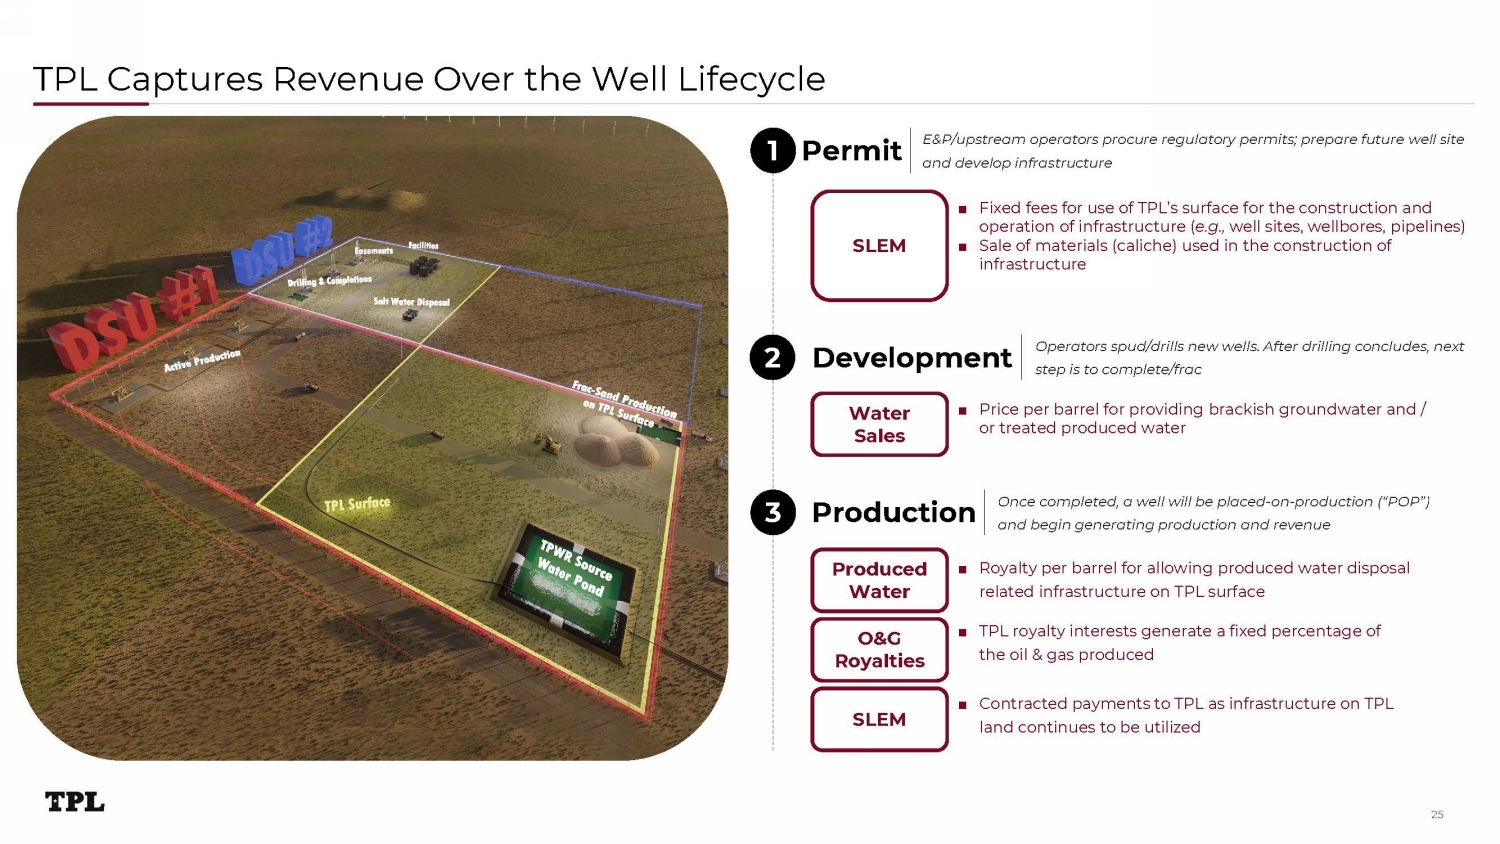
TPL Captures Revenue Over the Well Lifecycle 1 P er m i t E&P/upstream operators procure regulatory permits; prepare future well site and develop infrastructure ■ Fixed fees for use of TPL’s surface for the construction and operation of infrastructure ( e.g., well sites, wellbores, pipelines) ■ Sale of materials (caliche) used in the construction of infrastructure ■ Price per barrel for providing brackish groundwater and / or treated produced water ■ Royalty per barrel for allowing produced water disposal related infrastructure on TPL surface ■ TPL royalty interests generate a fixed percentage of the oil & gas produced 2 D eve l o p m ent 3 Production S LE M W a t er Sales Pr o d u c e d Water O&G R oya l t ies Operators spud/drills new wells. After drilling concludes, next step is to complete/frac Once completed, a well will be placed - on - production (“POP”) and begin generating production and revenue S LE M ■ Contracted payments to TPL as infrastructure on TPL land continues to be utilized 25
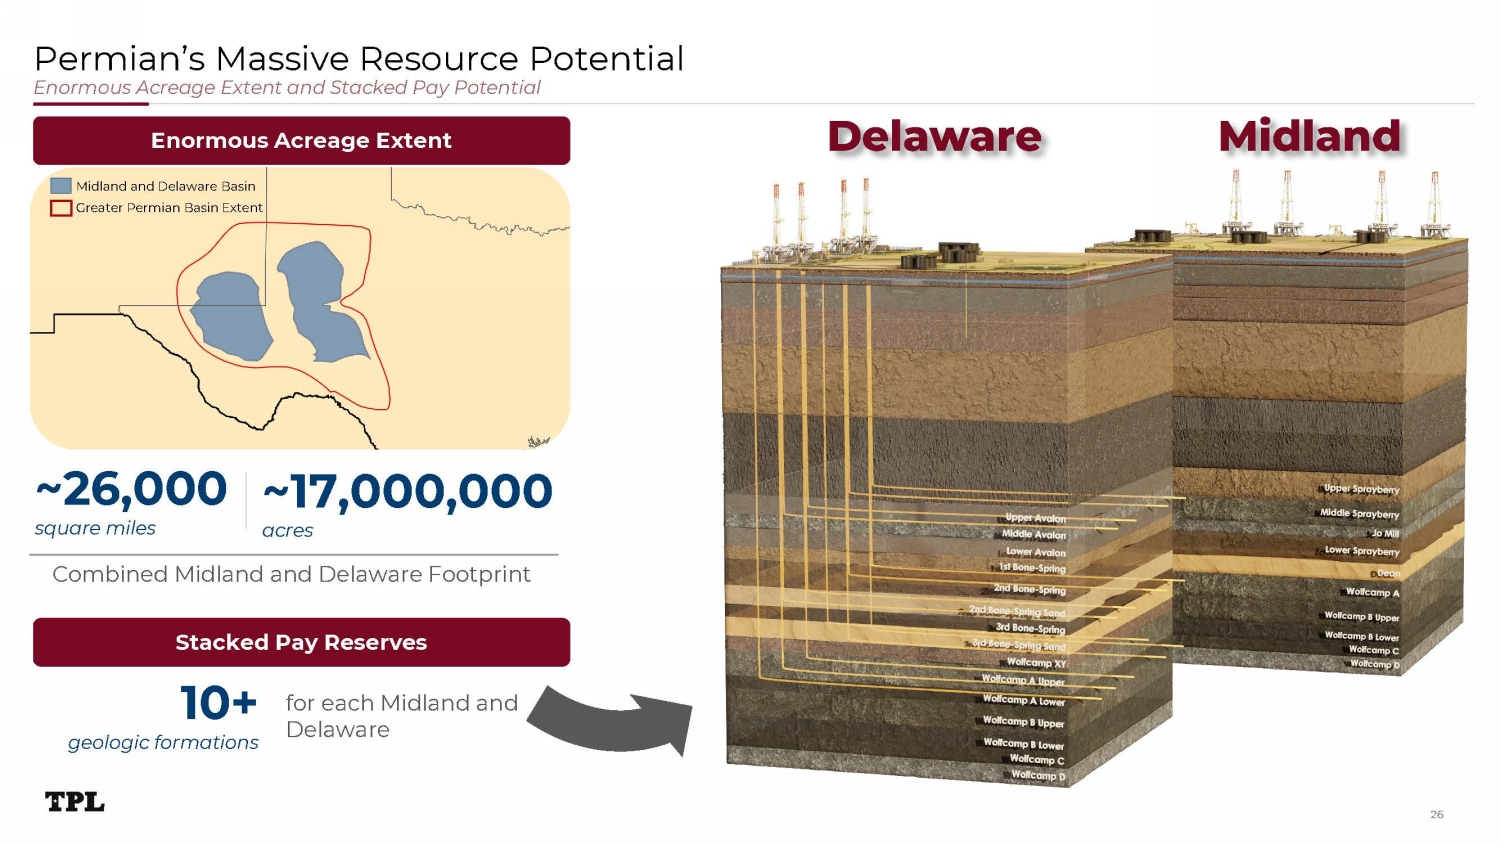
Permian’s Massive Resource Potential Enormous Acreage Extent and Stacked Pay Potential square miles ~26,000 ~17,000,000 a c r es 10 + geologic formations for each Midland and Delaware Enormous Acreage Extent Midland and Delaware Basin Greater Permian Basin Extent Combined Midland and Delaware Footprint Stacked Pay Reserves 26
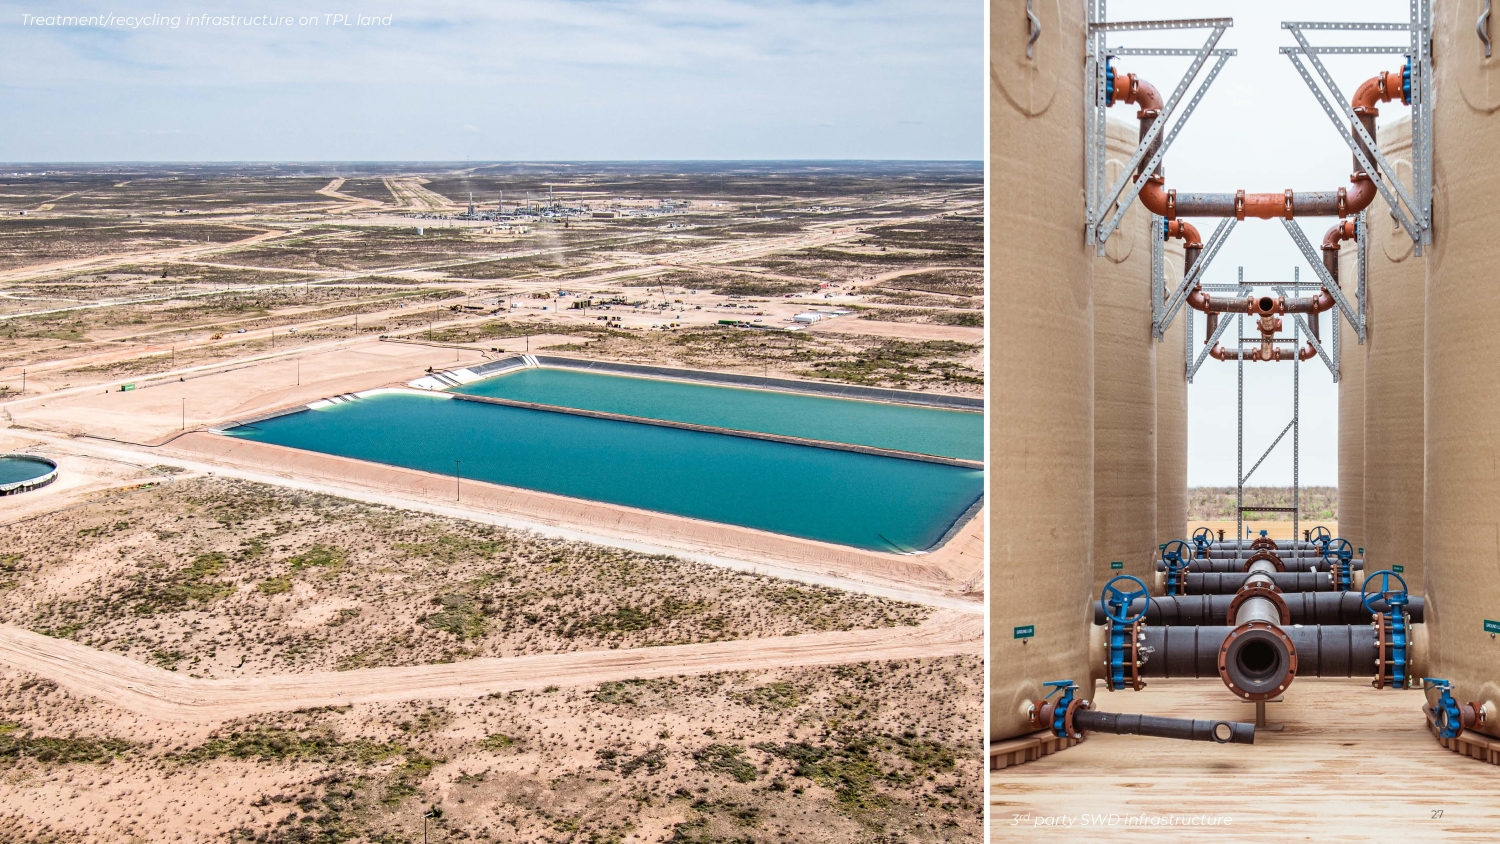
27 Treatment/recycling infrastructure on TPL land 3 rd party SWD infrastructure

Appendix
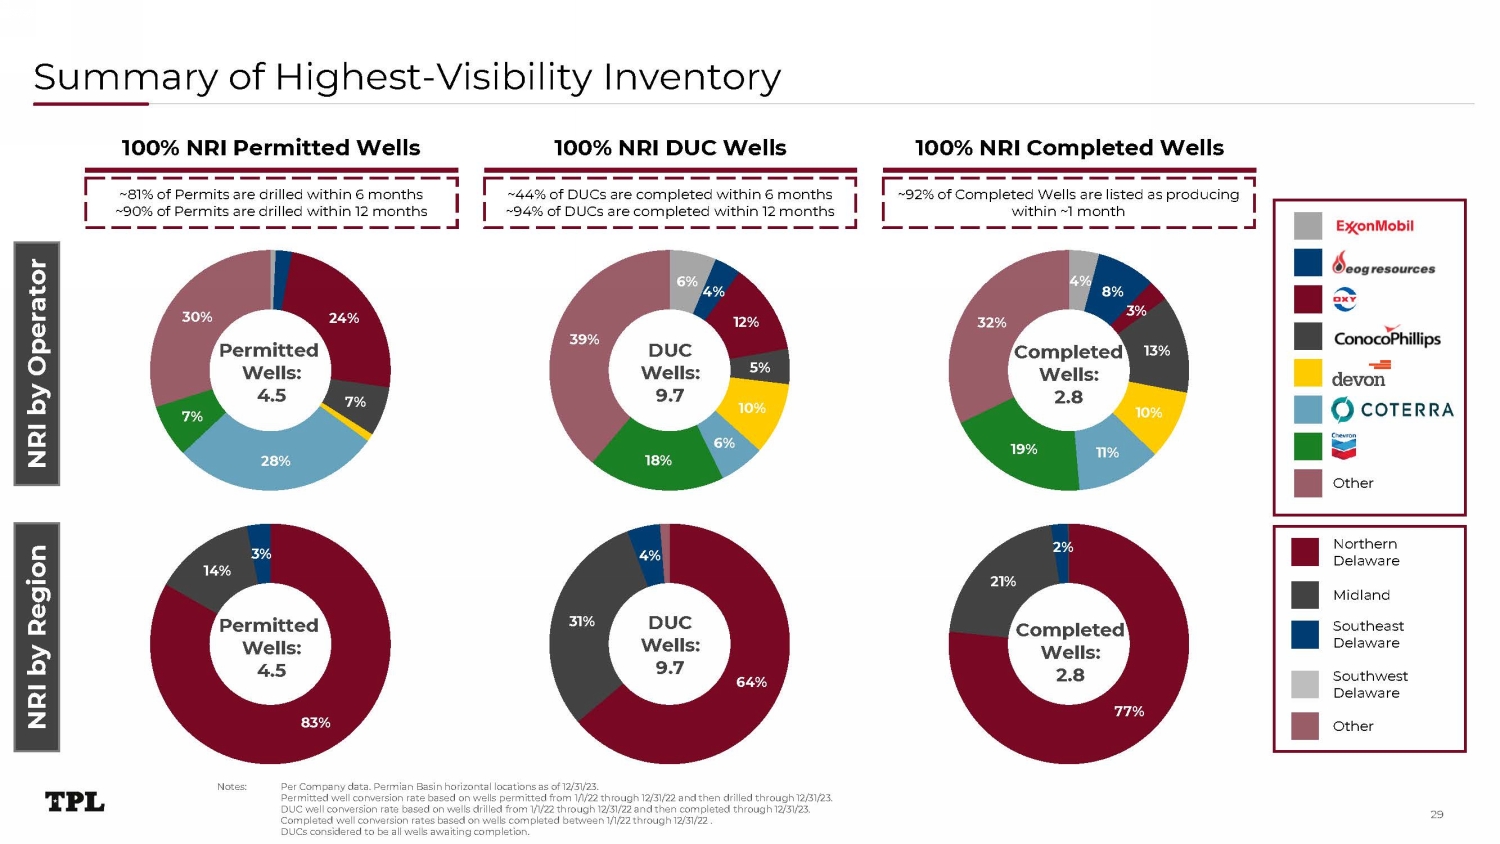
Summary of Highest - Visibility Inventory N o t e s: Per Company data. Permian Basin horizontal locations as of 12/31/23. Permitted well conversion rate based on wells permitted from 1/1/22 through 12/31/22 and then drilled through 12/31/23. DUC well conversion rate based on wells drilled from 1/1/22 through 12/31/22 and then completed through 12/31/23. Completed well conversion rates based on wells completed between 1/1/22 through 12/31/22 . DUCs considered to be all wells awaiting completion. 100% NRI Permitted Wells 100% NRI DUC Wells 100% NRI Completed Wells 2 4 % 7% 2 8 % 7% 3 0 % 8 3% 1 4 % 3% 6% 4% 12 % 5% 1 0 % 6% 1 8 % 3 9 % 64 % 31% 4% 2 1% 2% C o m p let ed Wells: 2.8 77% 4% 8% 3% 13% 1 0 % 11% 1 9 % 32 % NRI by Region NRI by Operator ~81% of Permits are drilled within 6 months ~90% of Permits are drilled within 12 months ~44% of DUCs are completed within 6 months ~94% of DUCs are completed within 12 months ~92% of Completed Wells are listed as producing within ~1 month Northern D e l a w ar e Midland S o ut h ea s t Delaware S o ut h w e s t Delaware Other P er m i t t ed Wells: 4.5 DUC W ells: 9.7 C o m p let ed Wells: 2.8 P er m i t t ed Wells: 4.5 DUC W ells: 9.7 O t h e r 29
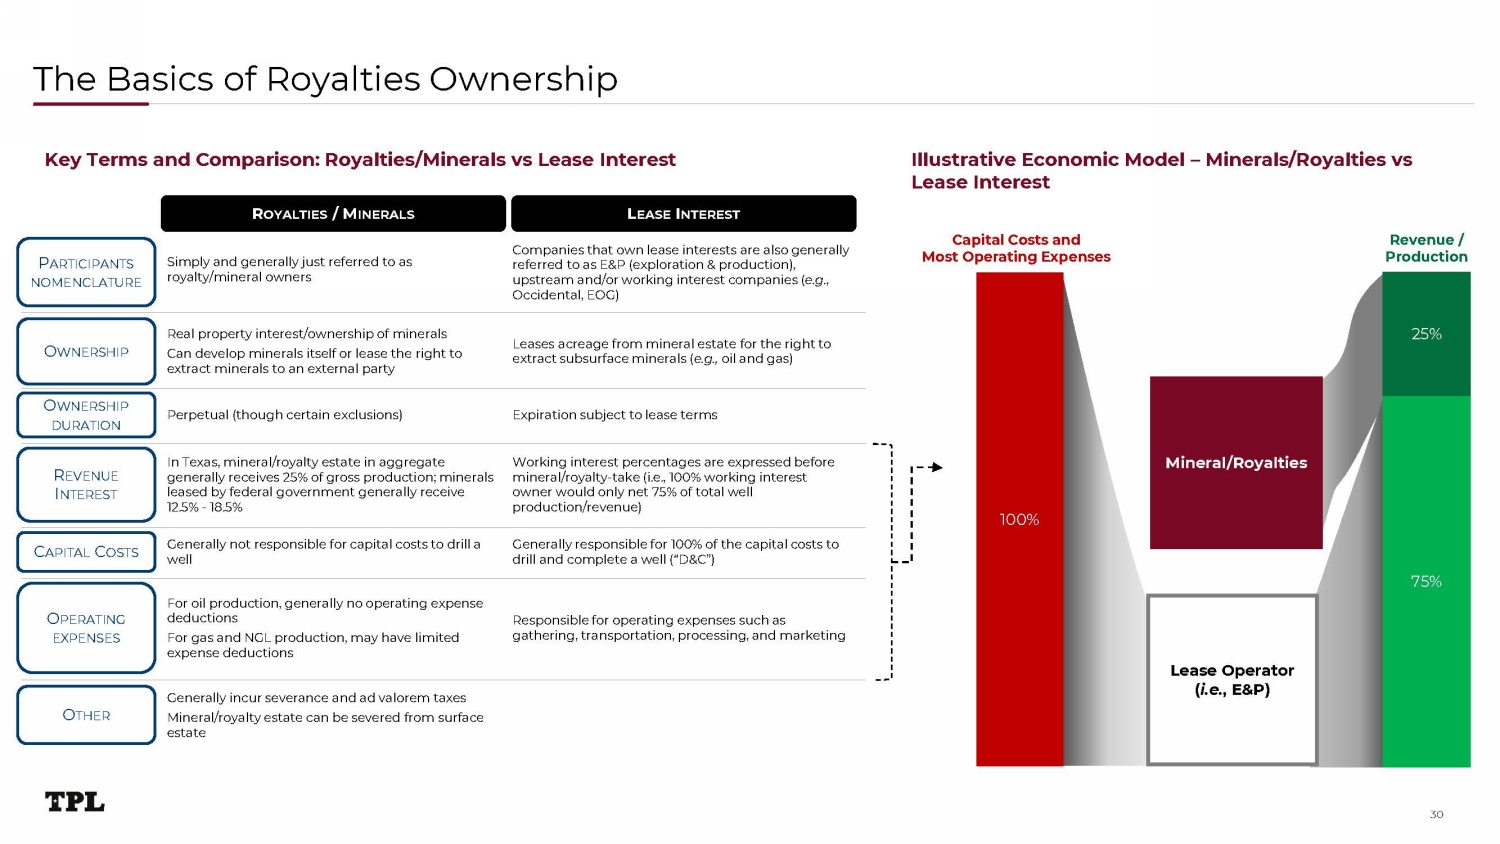
The Basics of Royalties Ownership 100% Lease Operator ( i.e. , E&P) Mineral/Royalties Capital Costs and Most Operating Expenses Revenue / P ro d u c t i o n Illustrative Economic Model – Minerals/Royalties vs Lease Interest Key Terms and Comparison: Royalties/Minerals vs Lease Interest P ARTICIPANTS N O M EN C L A T U RE O WN E R S H I P Real property interest/ownership of minerals Can develop minerals itself or lease the right to extract minerals to an external party Leases acreage from mineral estate for the right to extract subsurface minerals ( e.g., oil and gas) C APITAL C OSTS Simply and generally just referred to as royalty/mineral owners Companies that own lease interests are also generally referred to as E&P (exploration & production), upstream and/or working interest companies ( e.g. , Occidental, EOG) Generally not responsible for capital costs to drill a well Generally responsible for 100% of the capital costs to drill and complete a well (“D&C”) O P E R A T I NG EXPENSES For oil production, generally no operating expense deductions For gas and NGL production, may have limited expense deductions Responsible for operating expenses such as gathering, transportation, processing, and marketing O THER Generally incur severance and ad valorem taxes Mineral/royalty estate can be severed from surface estate O WN E R S H I P DURATION Perpetual (though certain exclusions) Expiration subject to lease terms R OYALTIES / M INERALS L EASE I NTEREST R EVE N U E I NTEREST In Texas, mineral/royalty estate in aggregate generally receives 25% of gross production; minerals leased by federal government generally receive 12.5% - 18.5% Working interest percentages are expressed before mineral/royalty - take (i.e., 100% working interest owner would only net 75% of total well production/revenue) 7 5% 25% 30
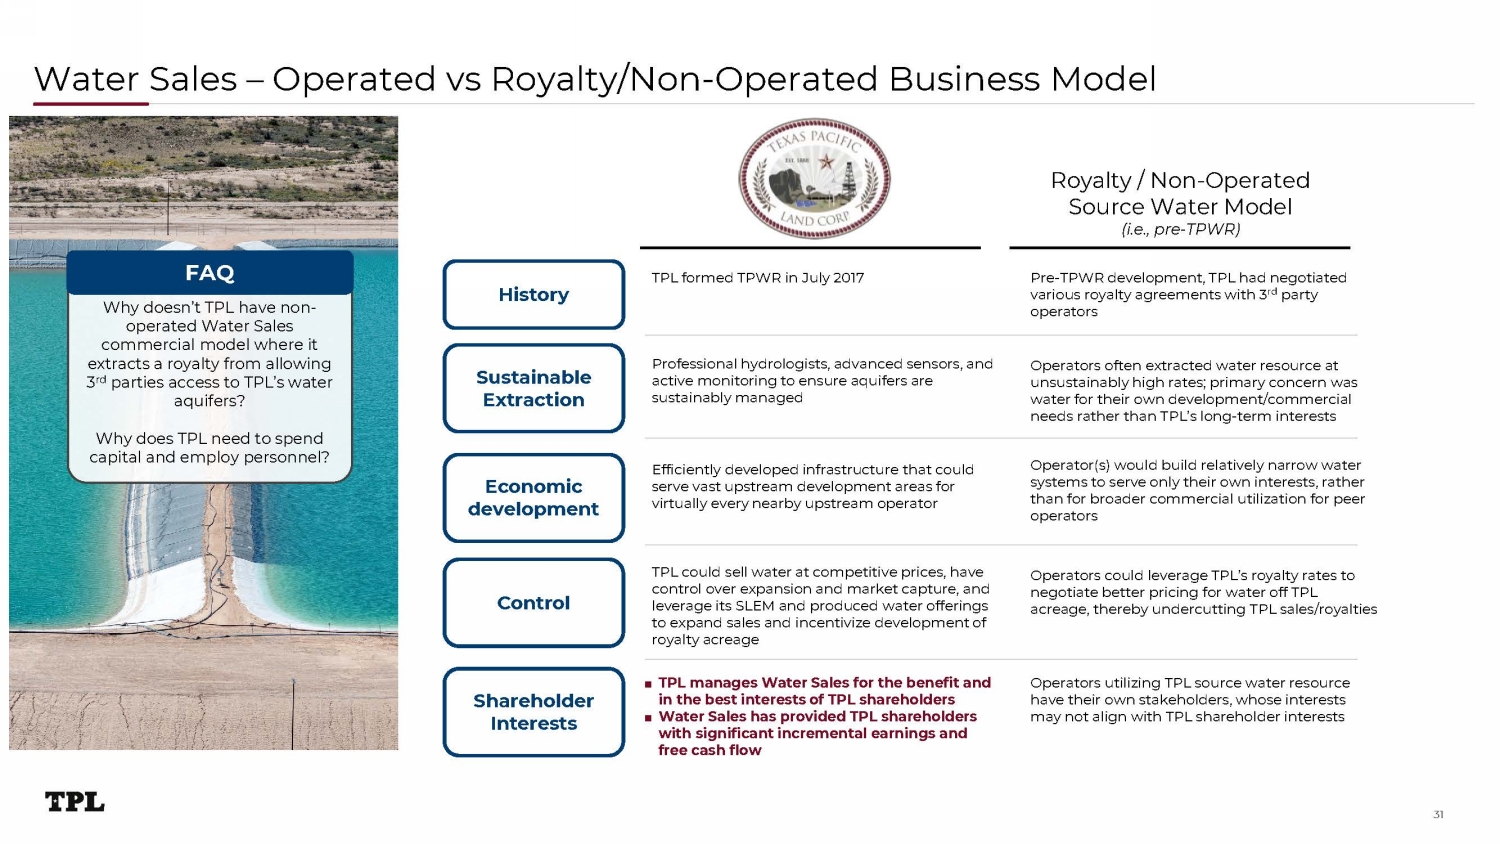
Why doesn’t TPL have non - operated Water Sales commercial model where it extracts a royalty from allowing 3 rd parties access to TPL’s water aquifers? Why does TPL need to spend capital and employ personnel? Water Sales – Operated vs Royalty/Non - Operated Business Model S u s t a in a b le Extraction Economic d e v el o p m ent Control S h a reh o ld er Interests Royalty / Non - Operated Source Water Model (i.e., pre - TPWR) Professional hydrologists, advanced sensors, and active monitoring to ensure aquifers are sustainably managed H is t o ry TPL formed TPWR in July 2017 Pre - TPWR development, TPL had negotiated various royalty agreements with 3 rd party operators Operators often extracted water resource at unsustainably high rates; primary concern was water for their own development/commercial needs rather than TPL’s long - term interests Efficiently developed infrastructure that could serve vast upstream development areas for virtually every nearby upstream operator Operator(s) would build relatively narrow water systems to serve only their own interests, rather than for broader commercial utilization for peer operators TPL could sell water at competitive prices, have control over expansion and market capture, and leverage its SLEM and produced water offerings to expand sales and incentivize development of royalty acreage Operators could leverage TPL’s royalty rates to negotiate better pricing for water off TPL acreage, thereby undercutting TPL sales/royalties ■ TPL manages Water Sales for the benefit and in the best interests of TPL shareholders ■ Water Sales has provided TPL shareholders with significant incremental earnings and free cash flow Operators utilizing TPL source water resource have their own stakeholders, whose interests may not align with TPL shareholder interests FA Q 31
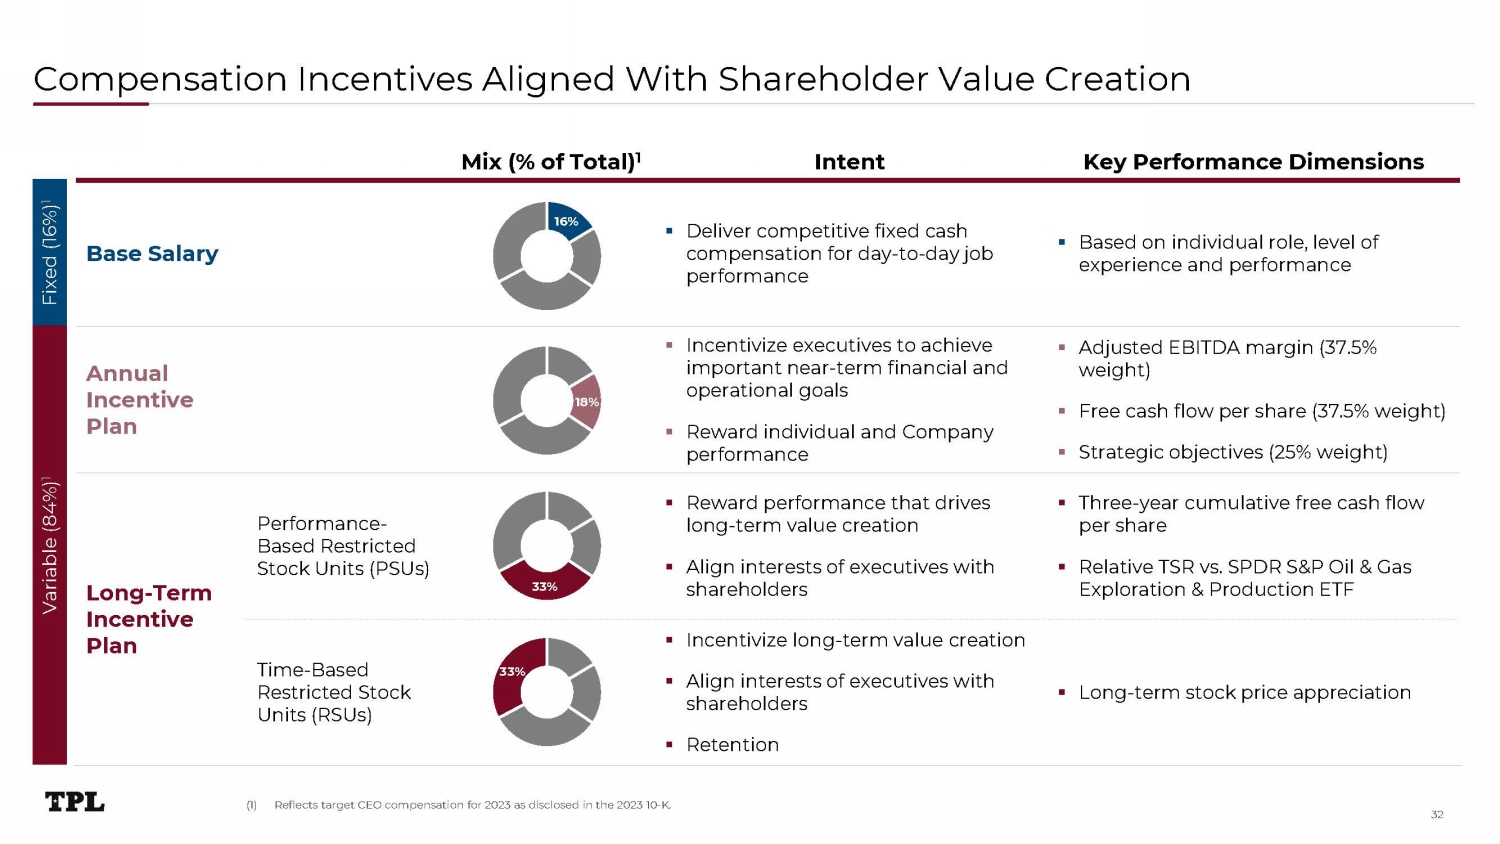
Compensation Incentives Aligned With Shareholder Value Creation Fixed (16%) 1 Variable (84%) 1 Mix (% of Total) 1 Base Salary 16% ▪ Deliver compensation performance Annual I n c ent i ve Plan 18% ▪ Incentivize important operational ▪ Reward performance Performance - Based Restricted Stock Units (PSUs) ▪ Reward long ▪ Align shareholders Long - Term 33% Incentive Plan ▪ Incentivize ▪ Align shareholders ▪ Retention Time - Based Restricted Stock Units (RSUs) 33% 32 (1) Reflects target CEO compensation for 2023 as disclosed in the 2023 10 - K.
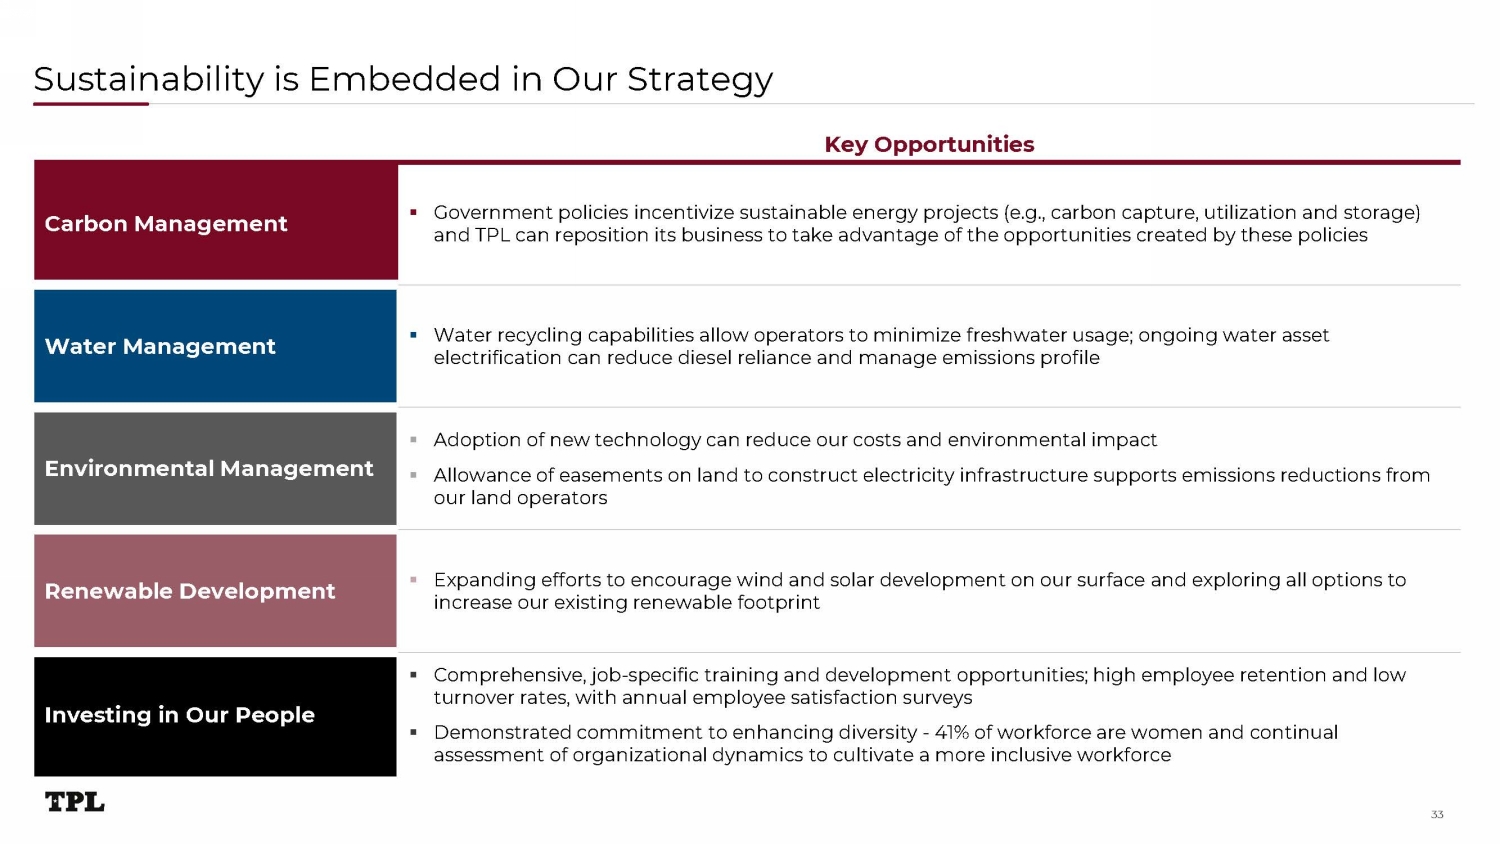
Sustainability is Embedded in Our Strategy 33 Key Opportunities Carbon Management ▪ Government policies incentivize sustainable energy projects (e.g., carbon capture, utilization and storage) and TPL can reposition its business to take advantage of the opportunities created by these policies Water Management ▪ Water recycling capabilities allow operators to minimize freshwater usage; ongoing water asset electrification can reduce diesel reliance and manage emissions profile Environmental Management ▪ Adoption of new technology can reduce our costs and environmental impact ▪ Allowance of easements on land to construct electricity infrastructure supports emissions reductions from our land operators Renewable Development ▪ Expanding efforts to encourage wind and solar development on our surface and exploring all options to increase our existing renewable footprint Investing in Our People ▪ Comprehensive, job - specific training and development opportunities; high employee retention and low turnover rates, with annual employee satisfaction surveys ▪ Demonstrated commitment to enhancing diversity - 41% of workforce are women and continual assessment of organizational dynamics to cultivate a more inclusive workforce
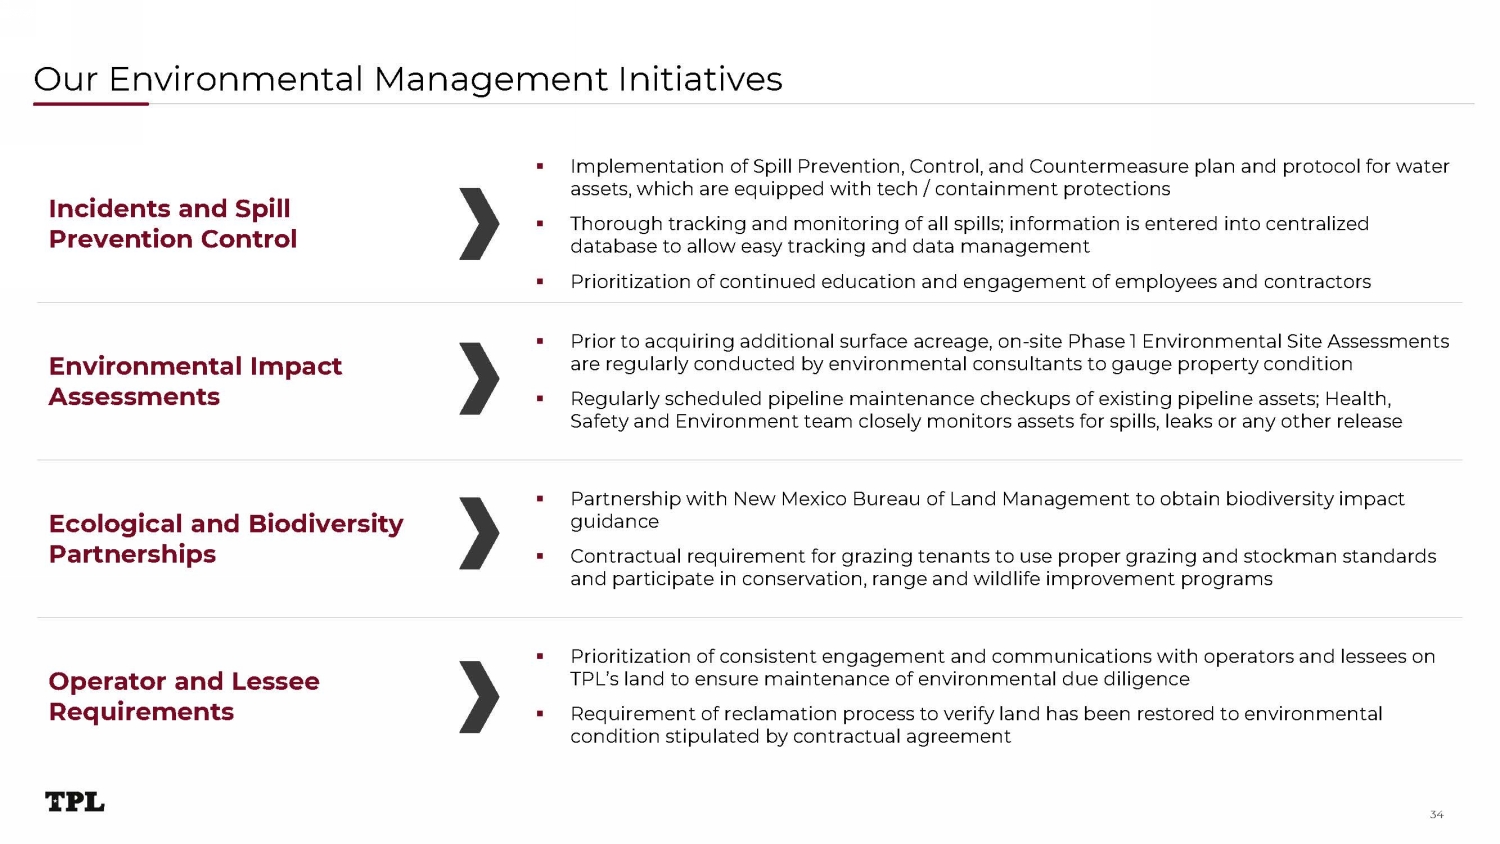
Our Environmental Management Initiatives Incidents and Spill Prevention Control ▪ Implementation of Spill Prevention, Control, and Countermeasure plan and protocol for water assets, which are equipped with tech / containment protections ▪ Thorough tracking and monitoring of all spills; information is entered into centralized database to allow easy tracking and data management ▪ Prioritization of continued education and engagement of employees and contractors Environmental Impact Assessments ▪ Prior to acquiring additional surface acreage, on - site Phase 1 Environmental Site Assessments are regularly conducted by environmental consultants to gauge property condition ▪ Regularly scheduled pipeline maintenance checkups of existing pipeline assets; Health, Safety and Environment team closely monitors assets for spills, leaks or any other release Ecological and Biodiversity Partnerships ▪ Partnership with New Mexico Bureau of Land Management to obtain biodiversity impact guidance ▪ Contractual requirement for grazing tenants to use proper grazing and stockman standards and participate in conservation, range and wildlife improvement programs Operator and Lessee Requirements ▪ Prioritization of consistent engagement and communications with operators and lessees on TPL’s land to ensure maintenance of environmental due diligence ▪ Requirement of reclamation process to verify land has been restored to environmental condition stipulated by contractual agreement 34
35
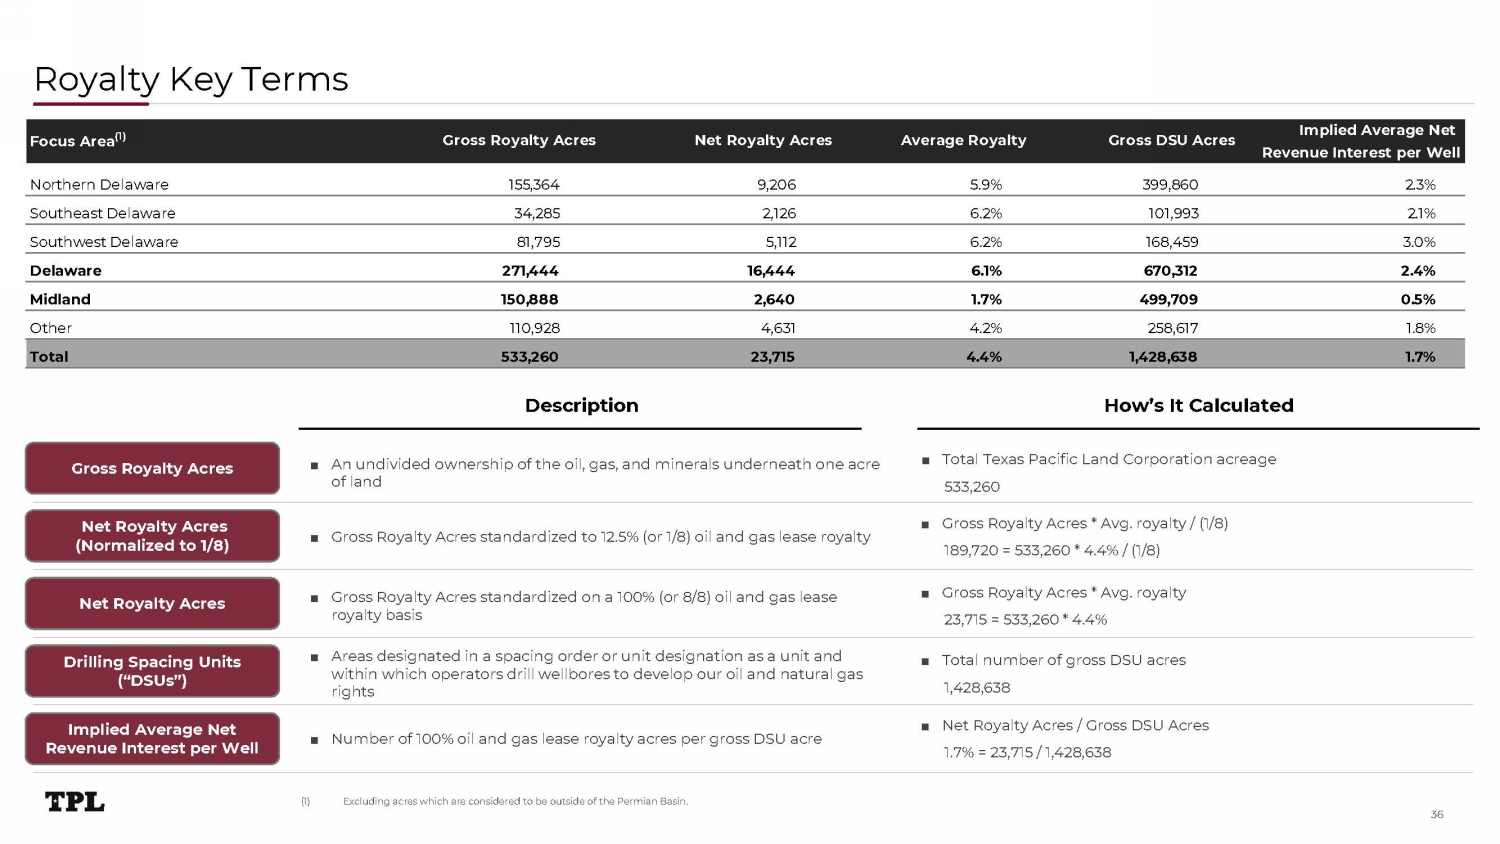
Royalty Key Terms Gross Royalty Acres Net Royalty Acres (Normalized to 1/8) Net Royalty Acres Drilling Spacing Units (“DSUs”) Implied Average Net Revenue Interest per Well ■ An undivided ownership of the oil, gas, and minerals underneath one acre of land ■ Total Texas Pacific Land Corporation acreage 533,260 ■ Gross Royalty Acres standardized to 12.5% (or 1/8) oil and gas lease royalty ■ Gross Royalty Acres standardized on a 100% (or 8/8) oil and gas lease royalty basis ■ Areas designated in a spacing order or unit designation as a unit and within which operators drill wellbores to develop our oil and natural gas rights ■ Number of 100% oil and gas lease royalty acres per gross DSU acre ■ Gross Royalty Acres * Avg. royalty / (1/8) 189,720 = 533,260 * 4.4% / (1/8) ■ Gross Royalty Acres * Avg. royalty 23,715 = 533,260 * 4.4% ■ Total number of gross DSU acres 1,428,638 ■ Net Royalty Acres / Gross DSU Acres 1.7% = 23,715 / 1,428,638 Northern Delaware 1 55 , 3 6 4 9 , 2 0 6 5 . 9 % 3 99 , 8 60 2 . 3 % Southeast Delaware 3 4 , 2 8 5 2 , 1 2 6 6 . 2 % 1 0 1 , 993 2 . 1 % Southwest Delaware 8 1 , 7 9 5 5 , 112 6 . 2 % 1 6 8 , 4 5 9 3 . 0 % Delaware 2 7 1 , 444 1 6 , 444 6 . 1 % 6 7 0 , 3 1 2 2 . 4% Midland 1 5 0 , 888 2 , 6 40 1 . 7 % 4 99 , 7 0 9 0 . 5 % Other 11 0 , 9 2 8 4 , 6 3 1 4 . 2 % 25 8 , 6 1 7 1 . 8% Total 5 33 , 2 6 0 23 , 7 1 5 4 . 4% 1 , 4 2 8 , 6 3 8 1 . 7 % Focus Area (1) Gross Royalty Acres Net Royalty Acres Average Royalty Gross DSU Acres Implied Average Net Revenue Interest per Well ( 1 ) Excluding acres which are considered to be outside of the Permian Basin. Description How’s It Calculated 36
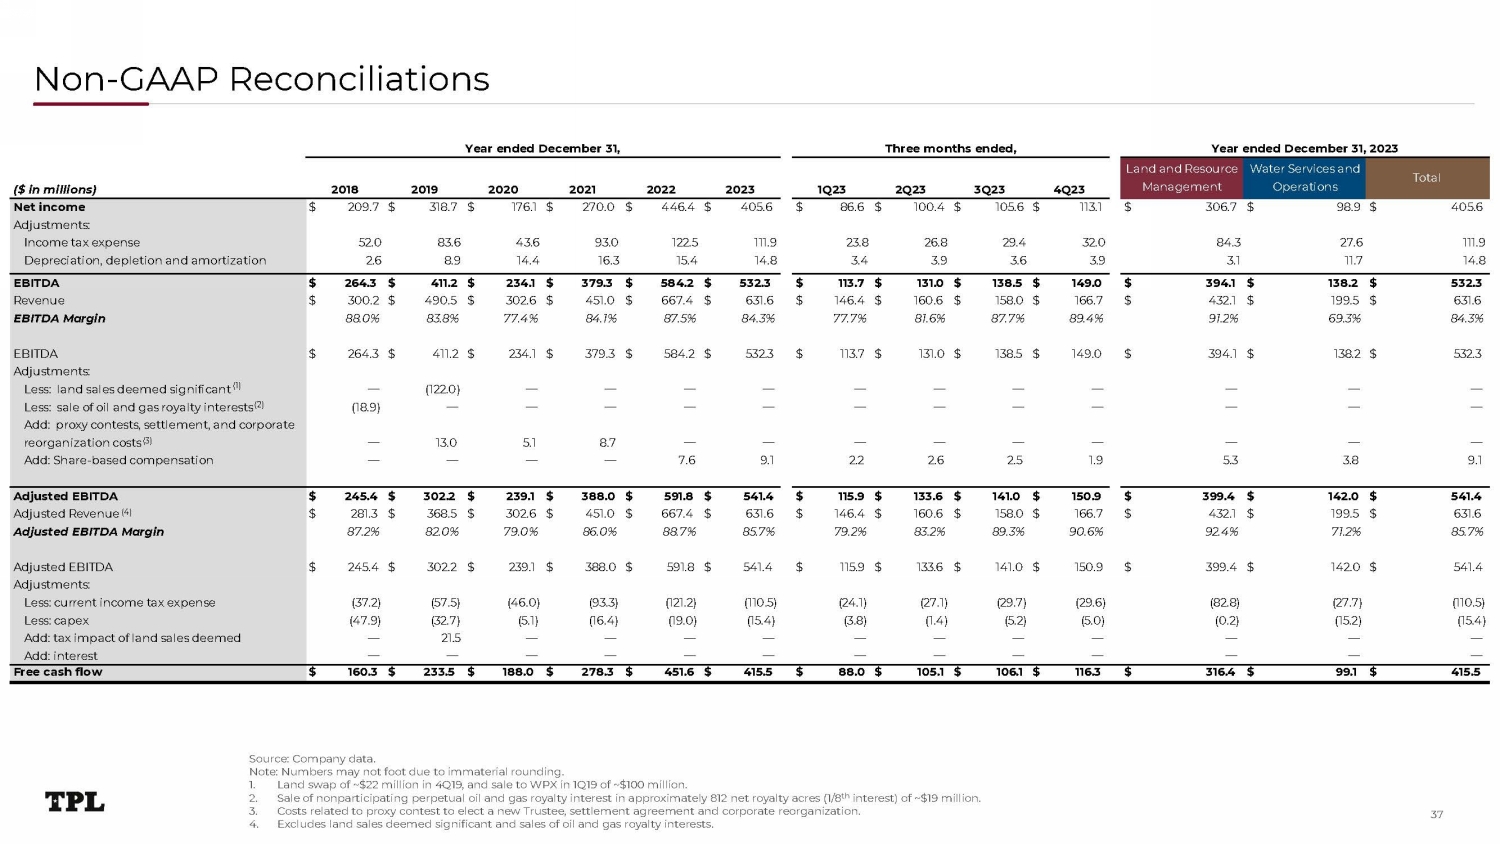
Land and Resource Water Services and Total 2018 2019 2020 2021 2022 2023 1Q23 2Q23 3Q23 4Q23 Management Operations Net income Adjustments: Income tax expense Depreciation, depletion and amortization $ 209.7 $ 318.7 $ 176.1 $ 270.0 $ 446.4 $ 405.6 52.0 83.6 43.6 93.0 122.5 111.9 2.6 8.9 14.4 16.3 15.4 14.8 $ 86.6 $ 100.4 $ 105.6 $ 113.1 23.8 26.8 29.4 32.0 3.4 3.9 3.6 3.9 $ 3 0 6 . 7 $ 9 8 . 9 $ 40 5 . 6 8 4 . 3 2 7 . 6 111 . 9 3 . 1 11 . 7 1 4 .8 EBITDA $ 264.3 $ 411.2 $ 234.1 $ 379.3 $ 584.2 $ 532.3 $ 11 3 . 7 $ 1 3 1 . 0 $ 1 3 8 . 5 $ 1 4 9 .0 $ 3 9 4 . 1 $ 1 3 8 . 2 $ 532 . 3 Revenue $ 300.2 $ 490.5 $ 302.6 $ 451.0 $ 667.4 $ 631.6 $ 1 4 6 . 4 $ 1 6 0 . 6 $ 1 5 8 . 0 $ 1 66 . 7 $ 4 3 2 . 1 $ 1 99 . 5 $ 6 3 1 . 6 EBITDA Margin 88 . 0 % 83 . 8 % 77 . 4 % 8 4 . 1 % 8 7 . 5 % 8 4 . 3 % 77 . 7 % 8 1 . 6% 8 7 . 7 % 8 9 . 4 % 9 1 . 2 % 69 . 3 % 8 4 . 3 % EBITDA $ 264.3 $ 411.2 $ 234.1 $ 379.3 $ 584.2 $ 532.3 $ 11 3 . 7 $ 1 3 1 . 0 $ 1 38 . 5 $ 1 4 9 . 0 $ 3 9 4 . 1 $ 1 38 . 2 $ 5 3 2 . 3 Adjustments: Less: land sales deemed significant (1) — ( 1 22 . 0 ) — — — — — — — — — — — Less: sale of oil and gas royalty interests (2) ( 1 8 . 9) — — — — — — — — — — — — Add: proxy contests, settlement, and corporate reorganization costs (3) — 1 3 . 0 5 . 1 8 . 7 — — — — — — — — — Add: Share - based compensation — — — — 7 . 6 9 . 1 2 . 2 2 . 6 2 . 5 1 . 9 5 . 3 3 . 8 9 . 1 Adjusted EBITDA $ 245.4 $ 302.2 $ 239.1 $ 388.0 $ 591.8 $ 541.4 $ 11 5 . 9 $ 1 33 . 6 $ 1 4 1 . 0 $ 1 5 0 .9 $ 3 99 . 4 $ 1 4 2 . 0 $ 5 4 1 . 4 Adjusted Revenue (4) $ 281.3 $ 368.5 $ 302.6 $ 451.0 $ 667.4 $ 631.6 $ 1 4 6 . 4 $ 1 6 0 . 6 $ 1 5 8 . 0 $ 1 66 . 7 $ 4 3 2 . 1 $ 1 99 . 5 $ 6 3 1 . 6 Adjusted EBITDA Margin 8 7 . 2 % 8 2 . 0 % 7 9 . 0 % 8 6 . 0 % 88 . 7 % 8 5 . 7 % 7 9 . 2 % 83 . 2 % 8 9 . 3 % 9 0 . 6% 9 2 . 4 % 71 . 2 % 8 5 . 7 % Adjusted EBITDA $ 245.4 $ 302.2 $ 239.1 $ 388.0 $ 591.8 $ 541.4 $ 11 5 . 9 $ 1 33 . 6 $ 1 4 1 . 0 $ 1 5 0 . 9 $ 3 99 . 4 $ 1 4 2 . 0 $ 5 4 1 . 4 Adjustments: Less: current income tax expense (3 7 . 2 ) ( 5 7 . 5 ) ( 4 6 . 0 ) ( 9 3 . 3 ) ( 1 2 1 . 2 ) ( 11 0 . 5 ) ( 2 4 . 1 ) ( 2 7 . 1 ) ( 2 9 . 7 ) ( 2 9 . 6) (8 2 . 8 ) ( 2 7 . 7 ) ( 11 0 . 5 ) Less: capex ( 4 7 . 9) (3 2 . 7 ) ( 5 . 1 ) ( 1 6 . 4 ) ( 1 9 . 0 ) ( 1 5 . 4 ) (3 . 8 ) ( 1 . 4 ) ( 5 . 2 ) ( 5 . 0 ) ( 0 . 2 ) ( 1 5 . 2 ) ( 1 5 . 4 ) Add: tax impact of land sales deemed — 2 1 . 5 — — — — — — — — — — — Add: interest — — — — — — — — — — — — — Free cash flow $ 160.3 $ 233.5 $ 188.0 $ 278.3 $ 451.6 $ 415.5 $ 88 . 0 $ 1 0 5 . 1 $ 1 0 6 . 1 $ 11 6 . 3 $ 3 1 6 . 4 $ 99 . 1 $ 4 1 5 . 5 ($ in millions) Year ended December 31, Three months ended, Year ended December 31, 2023 Non - GAAP Reconciliations Source: Company data. Note: Numbers may not foot due to immaterial rounding. 1. Land swap of ~$22 million in 4Q19, and sale to WPX in 1Q19 of ~$100 million. 2. Sale of nonparticipating perpetual oil and gas royalty interest in approximately 812 net royalty acres (1/8 th interest) of ~$19 million. 3. Costs related to proxy contest to elect a new Trustee, settlement agreement and corporate reorganization. 4. Excludes land sales deemed significant and sales of oil and gas royalty interests. 37
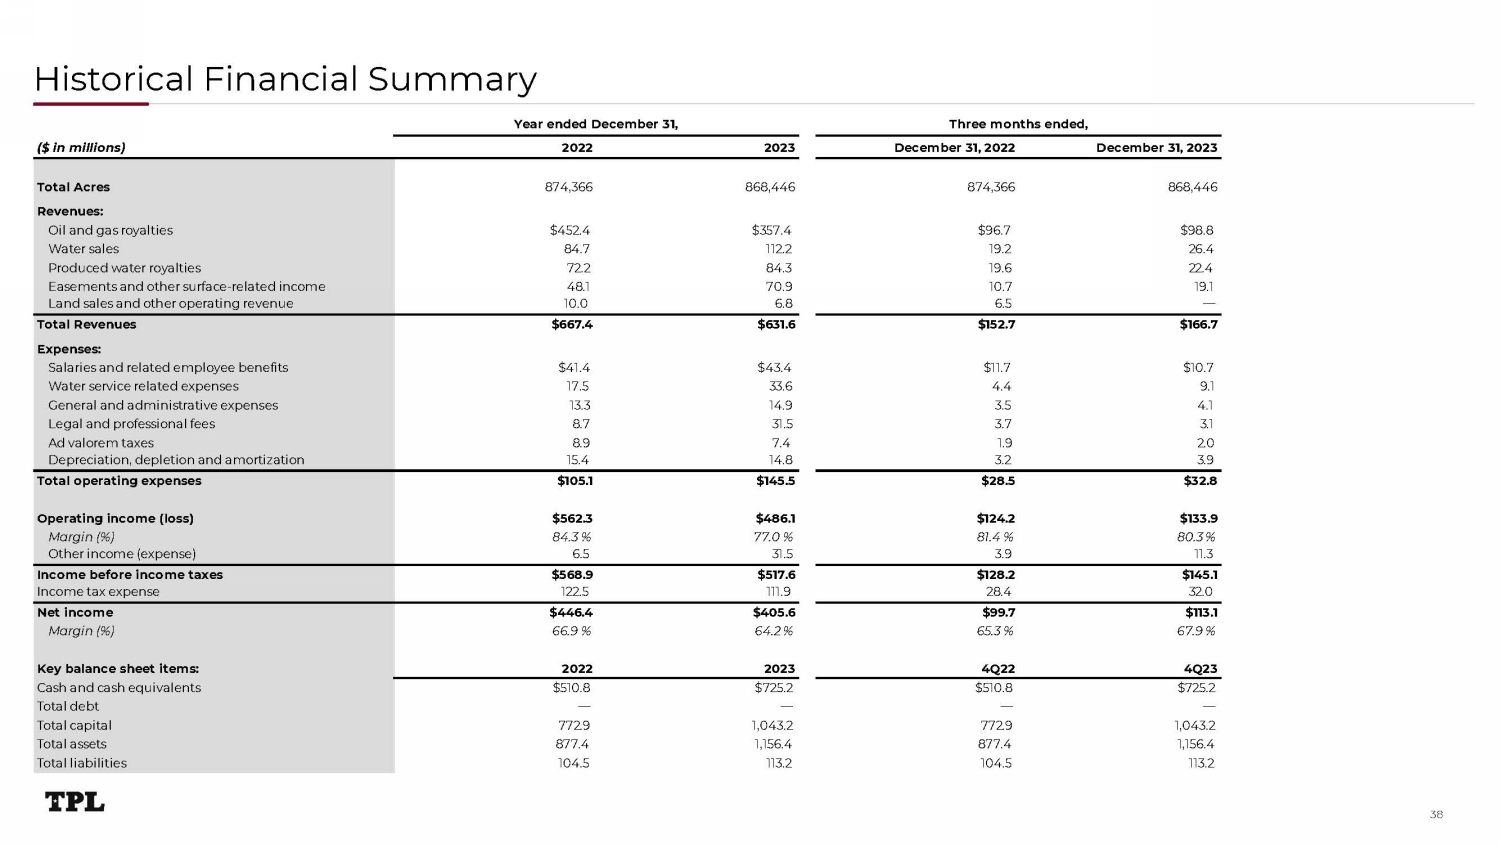
Historical Financial Summary Year ended December 31, Three months ended, ($ in millions) 2022 2 0 23 December 31, 2022 December 31, 2023 Total Acres 874,366 8 6 8 , 44 6 874,366 8 6 8 , 44 6 Revenues: Oil and gas royalties $452.4 $ 3 5 7 . 4 $96.7 $ 9 8 . 8 Water sales 84.7 11 2 . 2 19.2 2 6 . 4 Produced water royalties 72.2 8 4 . 3 19.6 22 . 4 Easements and other surface - related income 48.1 70 . 9 10.7 1 9 . 1 Land sales and other operating revenue 10.0 6 . 8 6.5 — Total Revenues $667.4 $6 3 1 .6 $152.7 $ 1 66 . 7 Expenses: Salaries and related employee benefits $41.4 $ 4 3 . 4 $11.7 $ 1 0 . 7 Water service related expenses 17.5 33 . 6 4.4 9 . 1 General and administrative expenses 13.3 1 4 . 9 3.5 4 .1 Legal and professional fees 8.7 3 1 . 5 3.7 3 . 1 Ad valorem taxes 8.9 7 .4 1.9 2 . 0 Depreciation, depletion and amortization 15.4 1 4 . 8 3.2 3 . 9 Total operating expenses $105.1 $ 1 4 5 .5 $28.5 $ 32 .8 Operating income (loss) $562.3 $ 4 8 6 .1 $124.2 $ 1 33 . 9 Margin (%) 84.3 % 77.0 % 81.4 % 80.3 % Other income (expense) 6.5 3 1 . 5 3.9 11 . 3 Income before income taxes $568.9 $ 5 1 7 .6 $128.2 $ 1 4 5 .1 Income tax expense 122.5 111 . 9 28.4 3 2 . 0 Net income $446.4 $ 4 0 5 .6 $99.7 $ 11 3 . 1 Margin (%) 66.9 % 64.2 % 65.3 % 67.9 % Key balance sheet items: 2022 2 0 23 4Q22 4Q 2 3 Cash and cash equivalents $510.8 $ 7 25 . 2 $510.8 $ 7 25 . 2 Total debt — — — — Total capital 772.9 1 , 04 3 .2 772.9 1 , 04 3 .2 Total assets 877.4 1 , 1 5 6 .4 877.4 1 , 1 5 6 .4 Total liabilities 104.5 11 3 . 2 104.5 11 3 . 2 38
Texas Pacific Land Corporation 1700 Pacific Avenue, Suite 2900 Dallas, Texas 75201