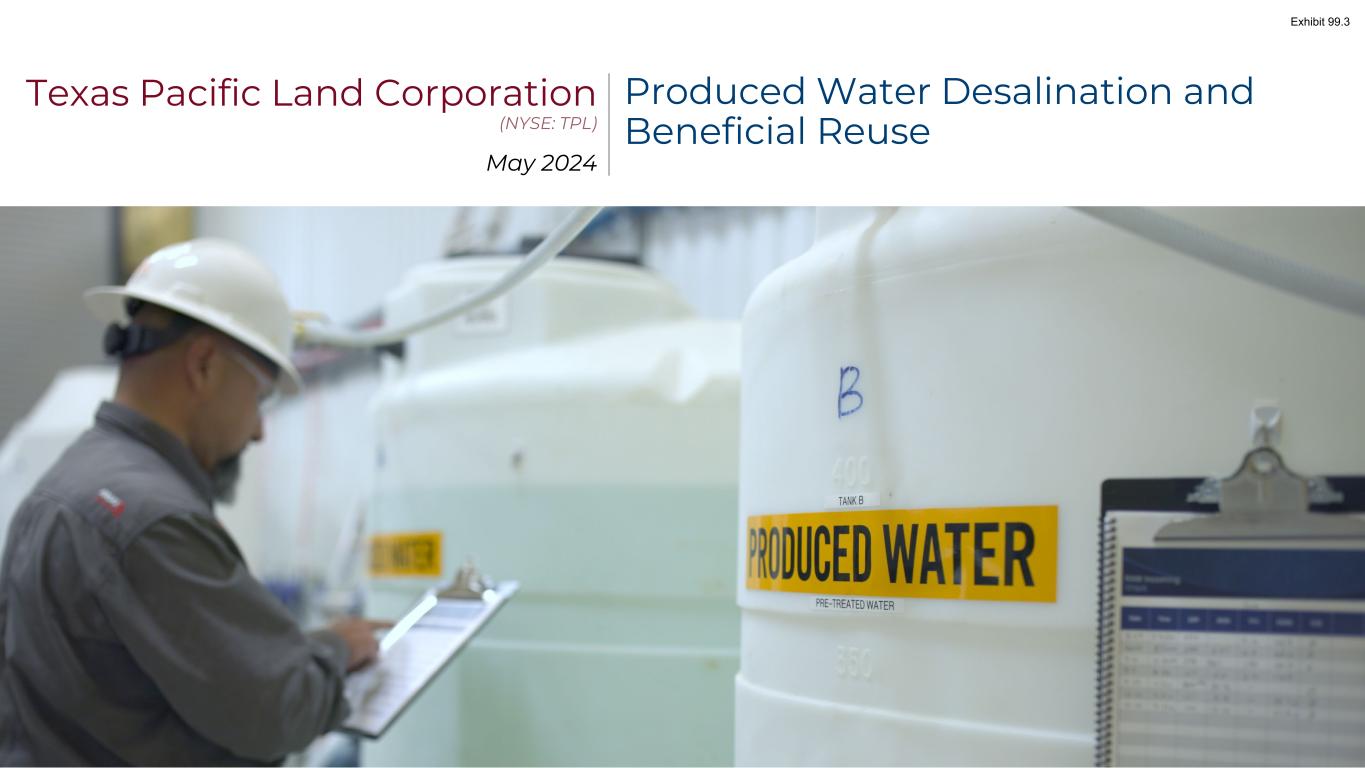
Texas Pacific Land Corporation (NYSE: TPL) May 2024 Produced Water Desalination and Beneficial Reuse Exhibit 99.3
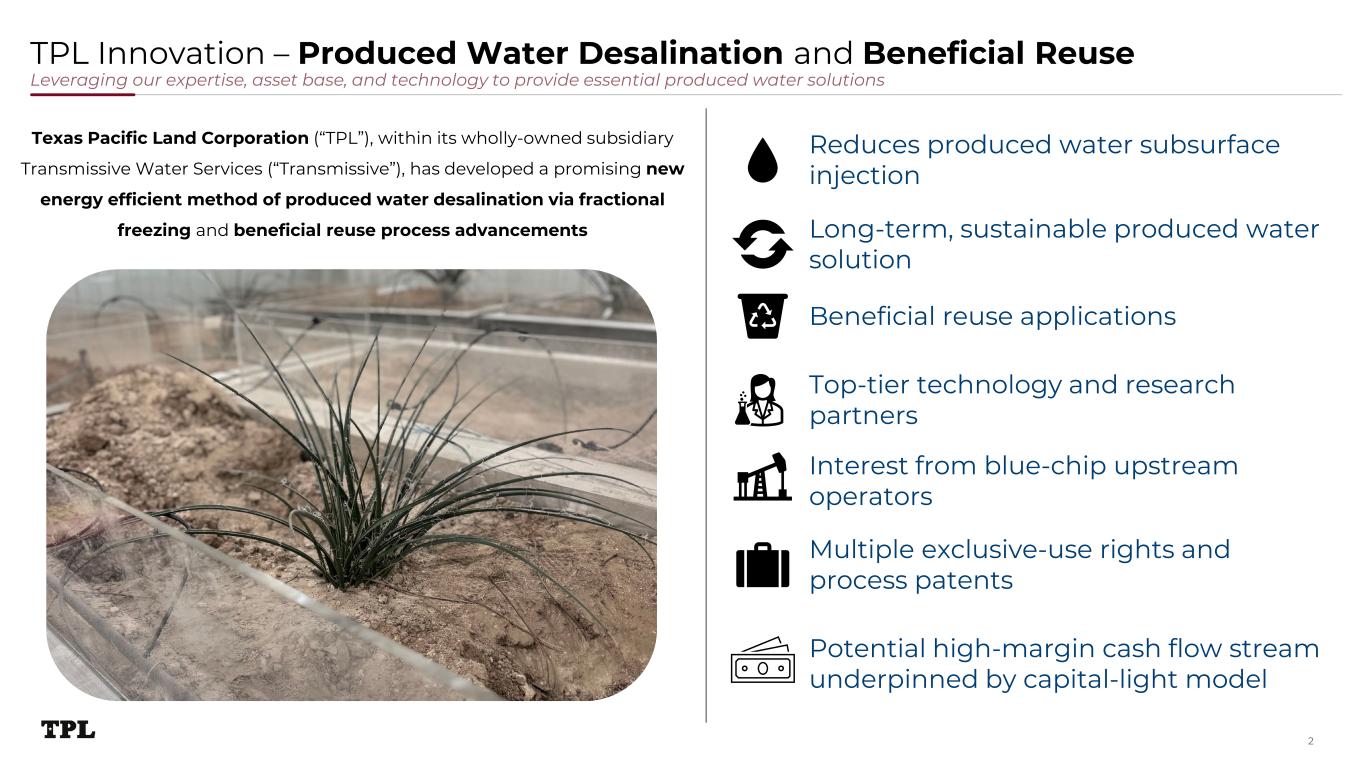
TPL Innovation – Produced Water Desalination and Beneficial Reuse Leveraging our expertise, asset base, and technology to provide essential produced water solutions 2 Texas Pacific Land Corporation (“TPL”), within its wholly-owned subsidiary Transmissive Water Services (“Transmissive”), has developed a promising new energy efficient method of produced water desalination via fractional freezing and beneficial reuse process advancements Long-term, sustainable produced water solution Reduces produced water subsurface injection Beneficial reuse applications Potential high-margin cash flow stream underpinned by capital-light model Top-tier technology and research partners Interest from blue-chip upstream operators Multiple exclusive-use rights and process patents
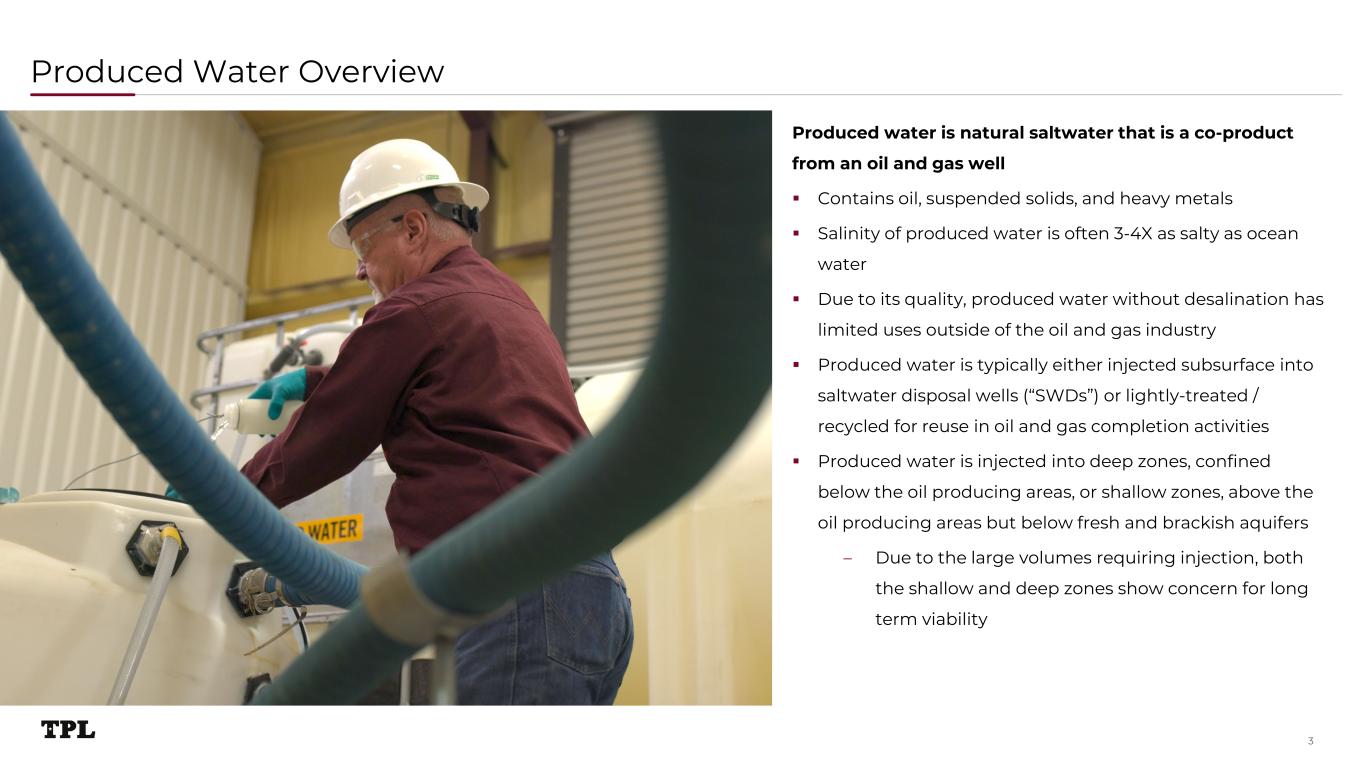
Produced Water Overview 3 Produced water is natural saltwater that is a co-product from an oil and gas well Contains oil, suspended solids, and heavy metals Salinity of produced water is often 3-4X as salty as ocean water Due to its quality, produced water without desalination has limited uses outside of the oil and gas industry Produced water is typically either injected subsurface into saltwater disposal wells (“SWDs”) or lightly-treated / recycled for reuse in oil and gas completion activities Produced water is injected into deep zones, confined below the oil producing areas, or shallow zones, above the oil producing areas but below fresh and brackish aquifers – Due to the large volumes requiring injection, both the shallow and deep zones show concern for long term viability
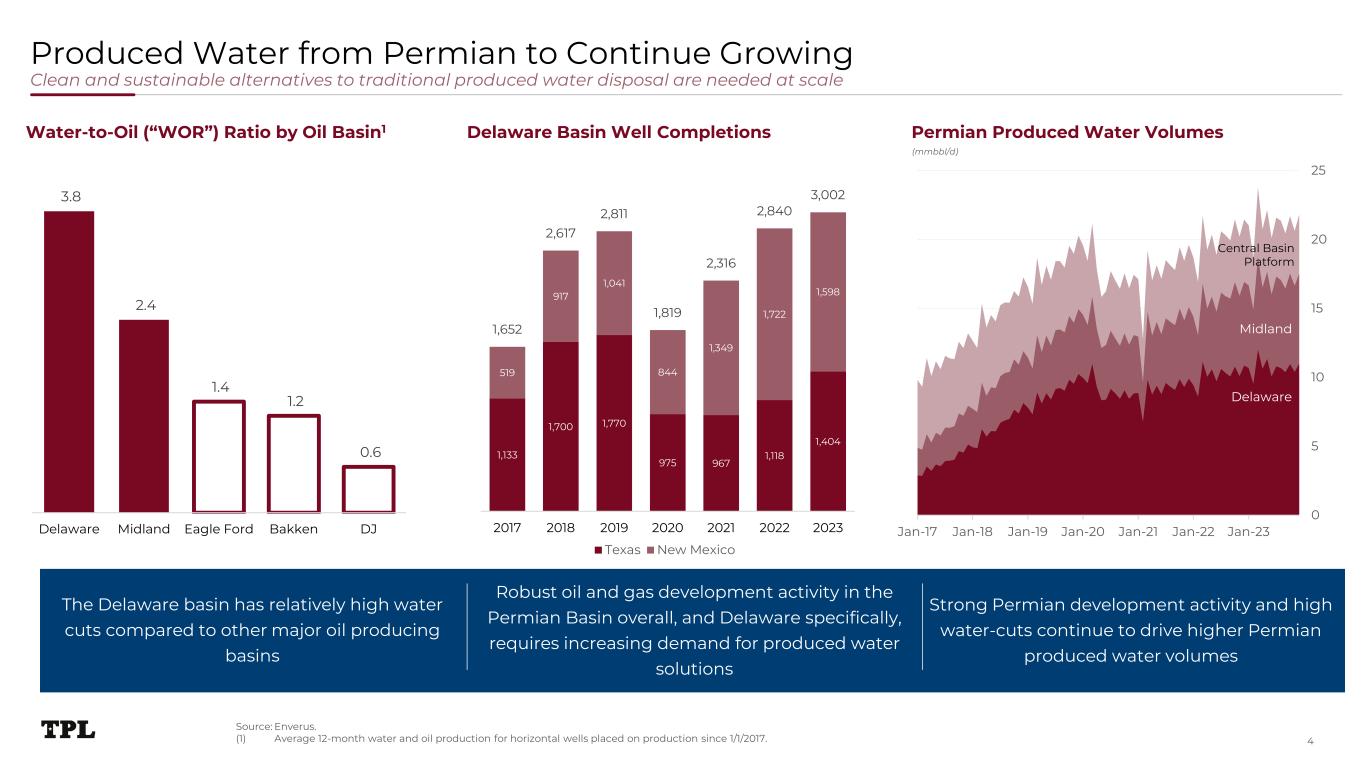
Produced Water from Permian to Continue Growing Clean and sustainable alternatives to traditional produced water disposal are needed at scale 4 Permian Produced Water Volumes (mmbbl/d) Delaware Basin Well CompletionsWater-to-Oil (“WOR”) Ratio by Oil Basin1 Robust oil and gas development activity in the Permian Basin overall, and Delaware specifically, requires increasing demand for produced water solutions Strong Permian development activity and high water-cuts continue to drive higher Permian produced water volumes The Delaware basin has relatively high water cuts compared to other major oil producing basins 3.8 2.4 1.4 1.2 0.6 Delaware Midland Eagle Ford Bakken DJ Source: Enverus. (1) Average 12-month water and oil production for horizontal wells placed on production since 1/1/2017. 1,133 1,700 1,770 975 967 1,118 1,404 519 917 1,041 844 1,349 1,722 1,598 1,652 2,617 2,811 1,819 2,316 2,840 3,002 2017 2018 2019 2020 2021 2022 2023 Texas New Mexico 0 5 10 15 20 25 Jan-17 Jan-18 Jan-19 Jan-20 Jan-21 Jan-22 Jan-23 Delaware Midland Central Basin Platform
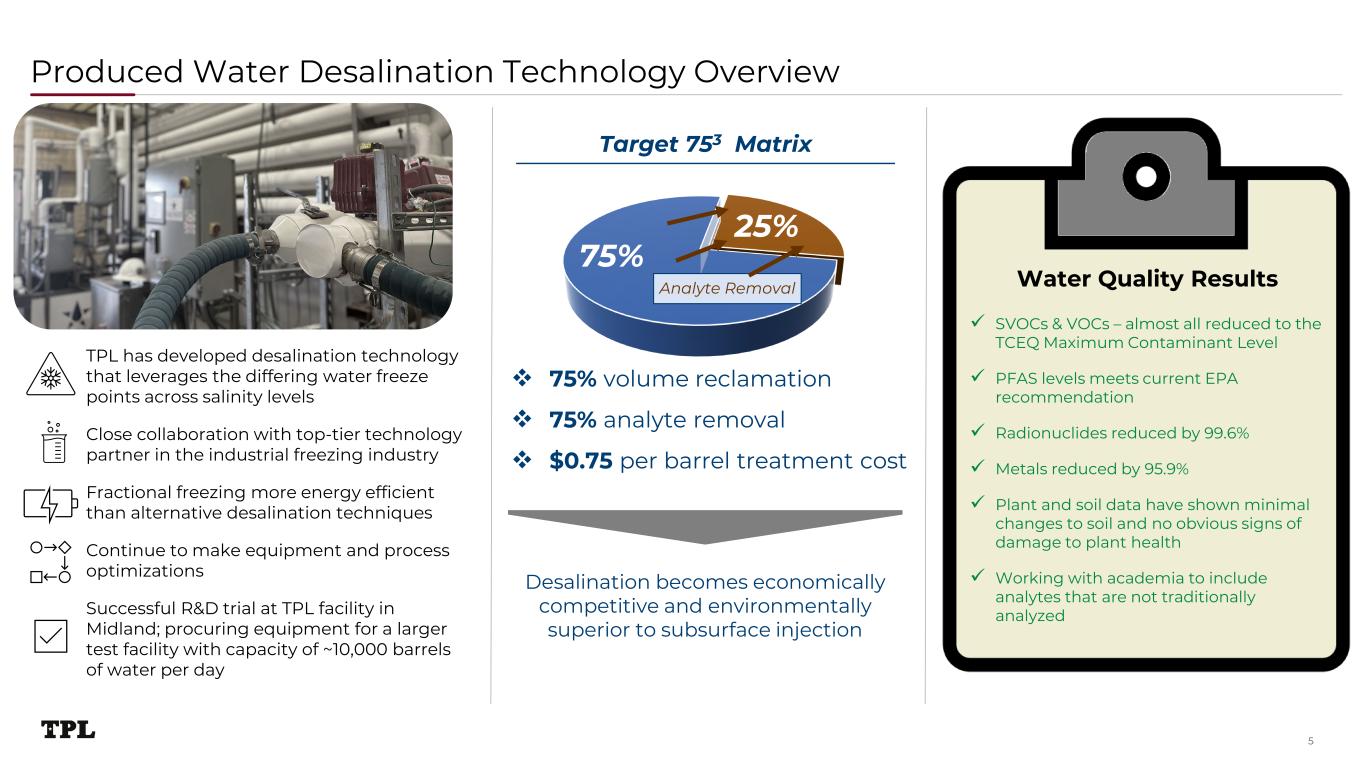
Produced Water Desalination Technology Overview 5 TPL has developed desalination technology that leverages the differing water freeze points across salinity levels Close collaboration with top-tier technology partner in the industrial freezing industry Fractional freezing more energy efficient than alternative desalination techniques Continue to make equipment and process optimizations Successful R&D trial at TPL facility in Midland; procuring equipment for a larger test facility with capacity of ~10,000 barrels of water per day 75% volume reclamation 75% analyte removal $0.75 per barrel treatment cost 25% 75% Analyte Removal Target 753 Matrix SVOCs & VOCs – almost all reduced to the TCEQ Maximum Contaminant Level PFAS levels meets current EPA recommendation Radionuclides reduced by 99.6% Metals reduced by 95.9% Plant and soil data have shown minimal changes to soil and no obvious signs of damage to plant health Working with academia to include analytes that are not traditionally analyzed Water Quality Results Desalination becomes economically competitive and environmentally superior to subsurface injection
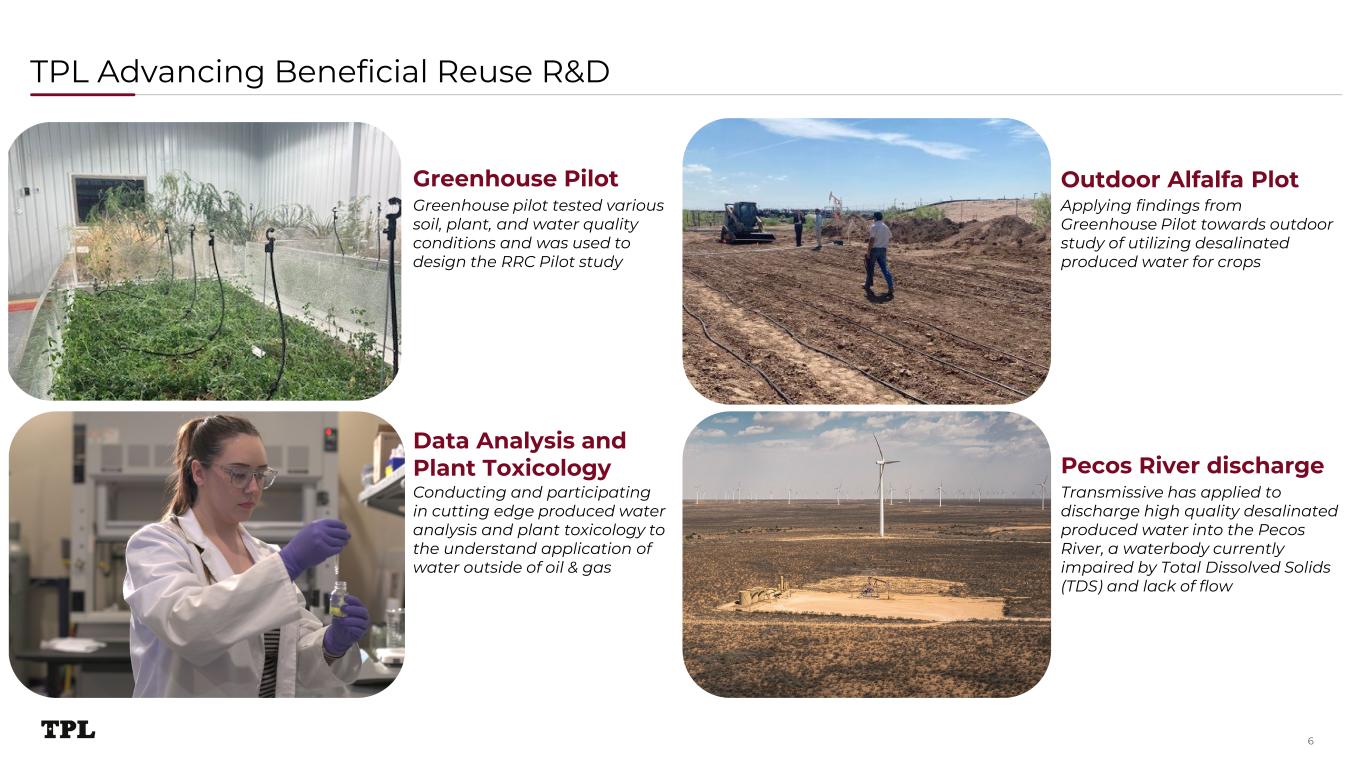
TPL Advancing Beneficial Reuse R&D 6 Greenhouse Pilot Outdoor Alfalfa Plot Data Analysis and Plant Toxicology Pecos River discharge Greenhouse pilot tested various soil, plant, and water quality conditions and was used to design the RRC Pilot study Transmissive has applied to discharge high quality desalinated produced water into the Pecos River, a waterbody currently impaired by Total Dissolved Solids (TDS) and lack of flow Conducting and participating in cutting edge produced water analysis and plant toxicology to the understand application of water outside of oil & gas Applying findings from Greenhouse Pilot towards outdoor study of utilizing desalinated produced water for crops
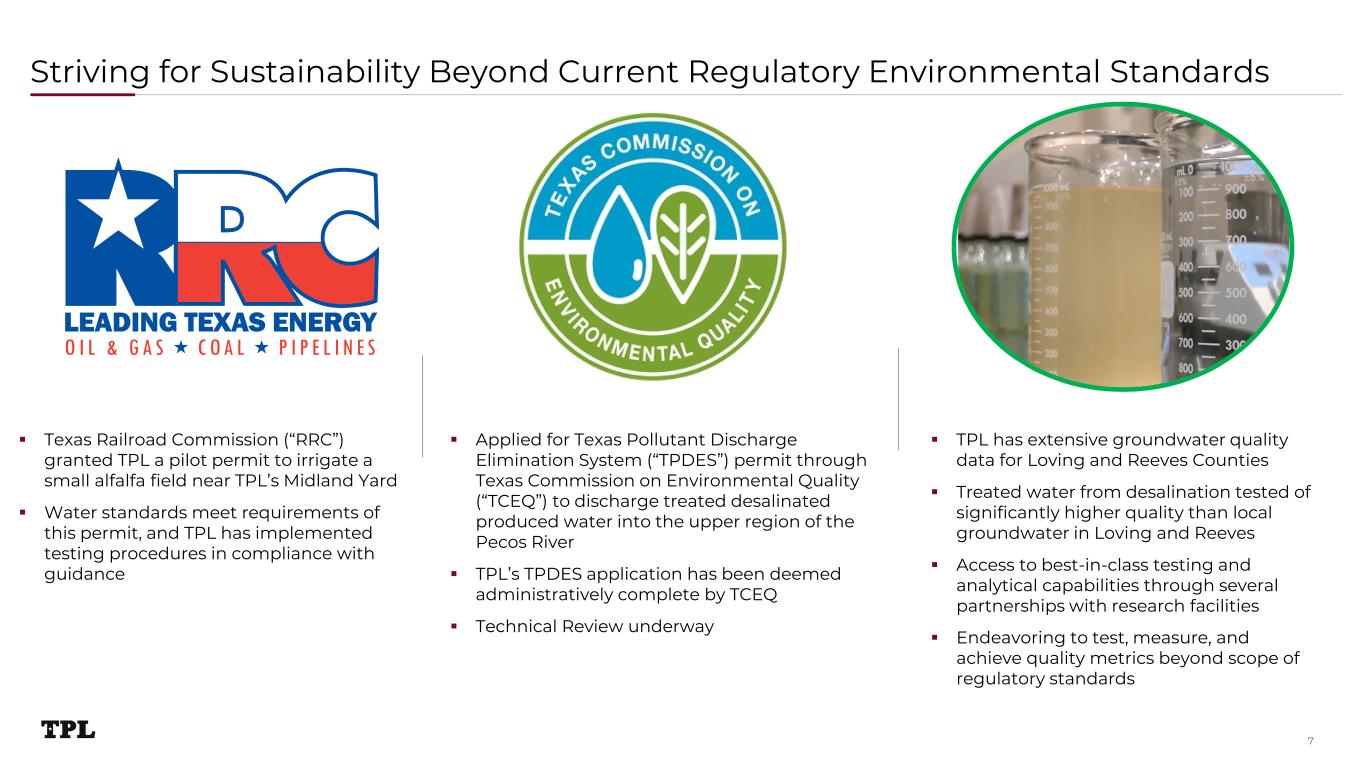
Striving for Sustainability Beyond Current Regulatory Environmental Standards 7 Texas Railroad Commission (“RRC”) granted TPL a pilot permit to irrigate a small alfalfa field near TPL’s Midland Yard Water standards meet requirements of this permit, and TPL has implemented testing procedures in compliance with guidance Applied for Texas Pollutant Discharge Elimination System (“TPDES”) permit through Texas Commission on Environmental Quality (“TCEQ”) to discharge treated desalinated produced water into the upper region of the Pecos River TPL’s TPDES application has been deemed administratively complete by TCEQ Technical Review underway TPL has extensive groundwater quality data for Loving and Reeves Counties Treated water from desalination tested of significantly higher quality than local groundwater in Loving and Reeves Access to best-in-class testing and analytical capabilities through several partnerships with research facilities Endeavoring to test, measure, and achieve quality metrics beyond scope of regulatory standards
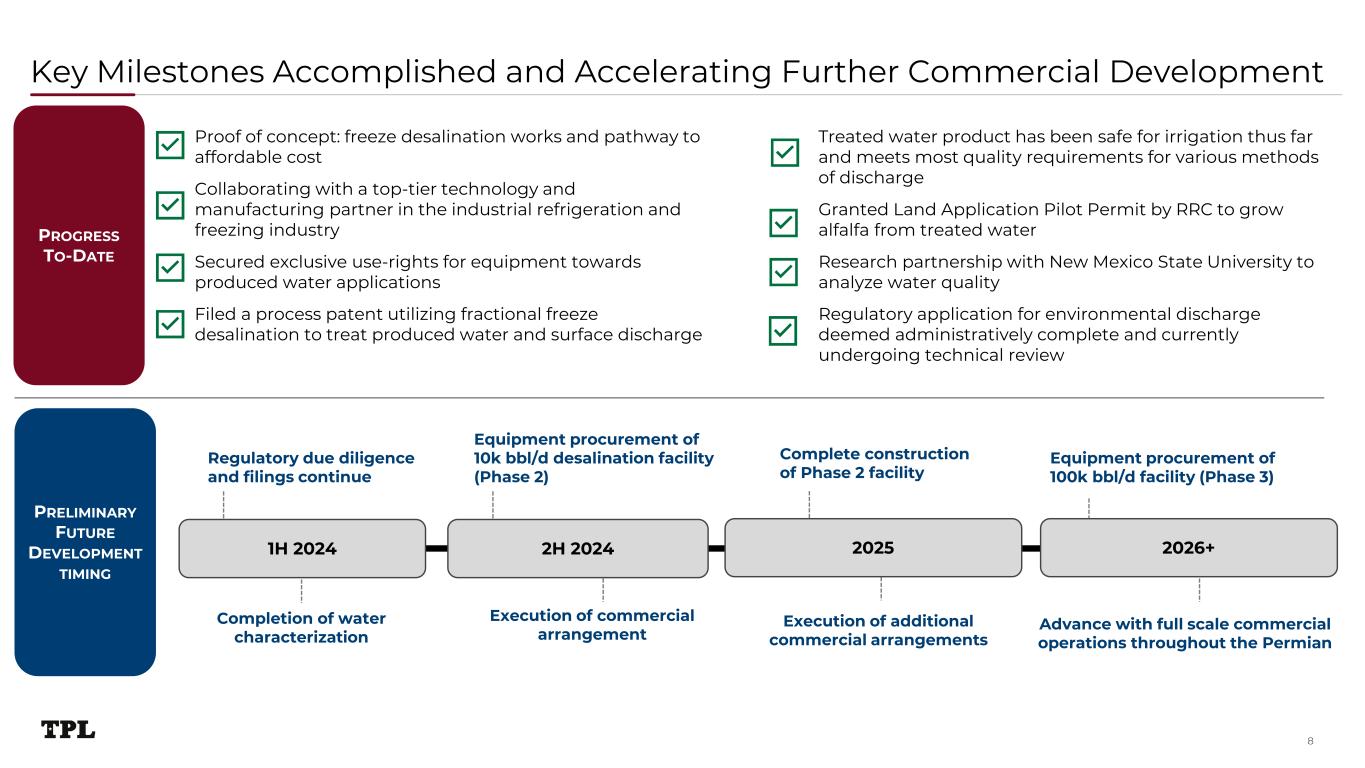
Key Milestones Accomplished and Accelerating Further Commercial Development 8 Proof of concept: freeze desalination works and pathway to affordable cost Collaborating with a top-tier technology and manufacturing partner in the industrial refrigeration and freezing industry Secured exclusive use-rights for equipment towards produced water applications Filed a process patent utilizing fractional freeze desalination to treat produced water and surface discharge 1H 2024 2H 2024 Completion of water characterization Regulatory due diligence and filings continue PROGRESS TO-DATE Treated water product has been safe for irrigation thus far and meets most quality requirements for various methods of discharge Granted Land Application Pilot Permit by RRC to grow alfalfa from treated water Research partnership with New Mexico State University to analyze water quality Regulatory application for environmental discharge deemed administratively complete and currently undergoing technical review PRELIMINARY FUTURE DEVELOPMENT TIMING Execution of commercial arrangement 2025 Equipment procurement of 100k bbl/d facility (Phase 3) Execution of additional commercial arrangements Equipment procurement of 10k bbl/d desalination facility (Phase 2) 2026+ Complete construction of Phase 2 facility Advance with full scale commercial operations throughout the Permian

Appendix
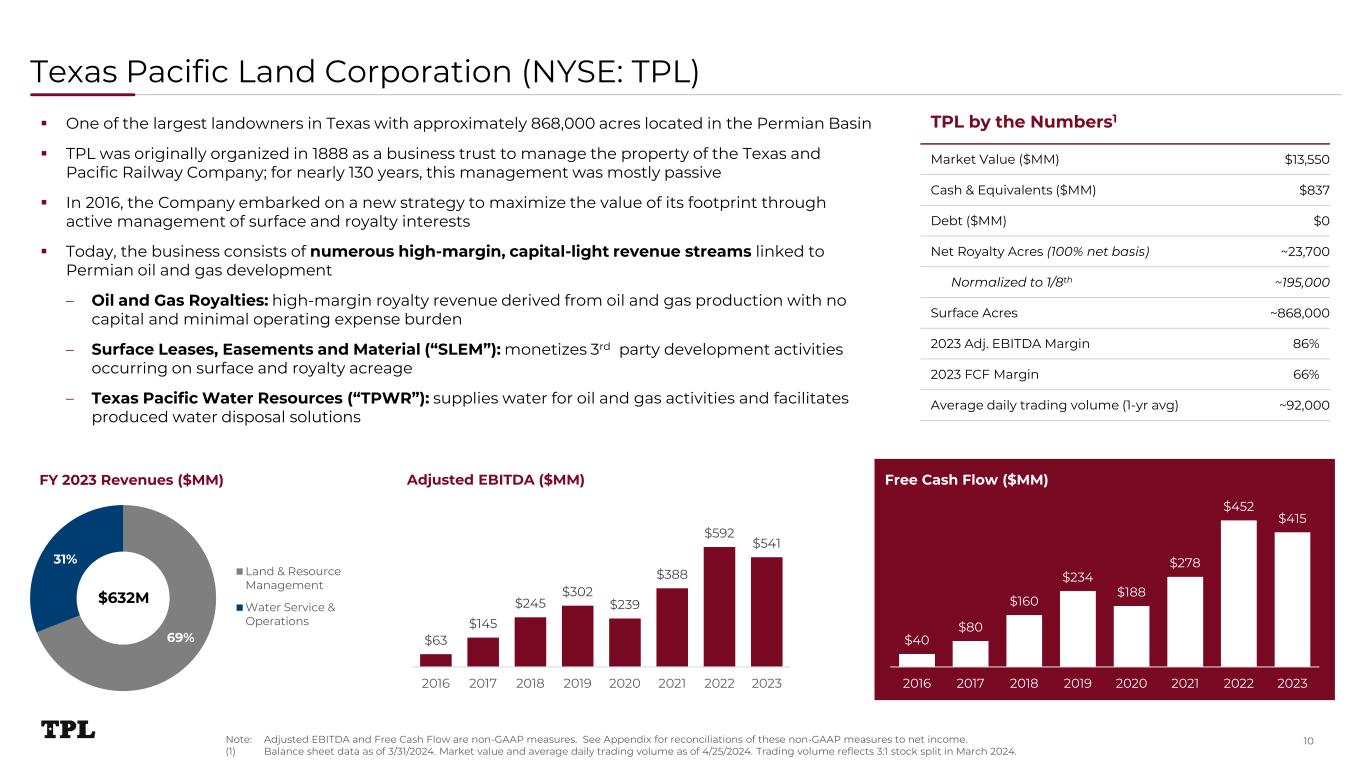
Texas Pacific Land Corporation (NYSE: TPL) TPL by the Numbers1 Market Value ($MM) $13,550 Cash & Equivalents ($MM) $837 Debt ($MM) $0 Net Royalty Acres (100% net basis) ~23,700 Normalized to 1/8th ~195,000 Surface Acres ~868,000 2023 Adj. EBITDA Margin 86% 2023 FCF Margin 66% Average daily trading volume (1-yr avg) ~92,000 Free Cash Flow ($MM)FY 2023 Revenues ($MM) One of the largest landowners in Texas with approximately 868,000 acres located in the Permian Basin TPL was originally organized in 1888 as a business trust to manage the property of the Texas and Pacific Railway Company; for nearly 130 years, this management was mostly passive In 2016, the Company embarked on a new strategy to maximize the value of its footprint through active management of surface and royalty interests Today, the business consists of numerous high-margin, capital-light revenue streams linked to Permian oil and gas development – Oil and Gas Royalties: high-margin royalty revenue derived from oil and gas production with no capital and minimal operating expense burden – Surface Leases, Easements and Material (“SLEM”): monetizes 3rd party development activities occurring on surface and royalty acreage – Texas Pacific Water Resources (“TPWR”): supplies water for oil and gas activities and facilitates produced water disposal solutions Adjusted EBITDA ($MM) 69% 31% Land & Resource Management Water Service & Operations $632M $63 $145 $245 $302 $239 $388 $592 $541 2016 2017 2018 2019 2020 2021 2022 2023 $40 $80 $160 $234 $188 $278 $452 $415 2016 2017 2018 2019 2020 2021 2022 2023 10Note: Adjusted EBITDA and Free Cash Flow are non-GAAP measures. See Appendix for reconciliations of these non-GAAP measures to net income. (1) Balance sheet data as of 3/31/2024. Market value and average daily trading volume as of 4/25/2024. Trading volume reflects 3:1 stock split in March 2024.
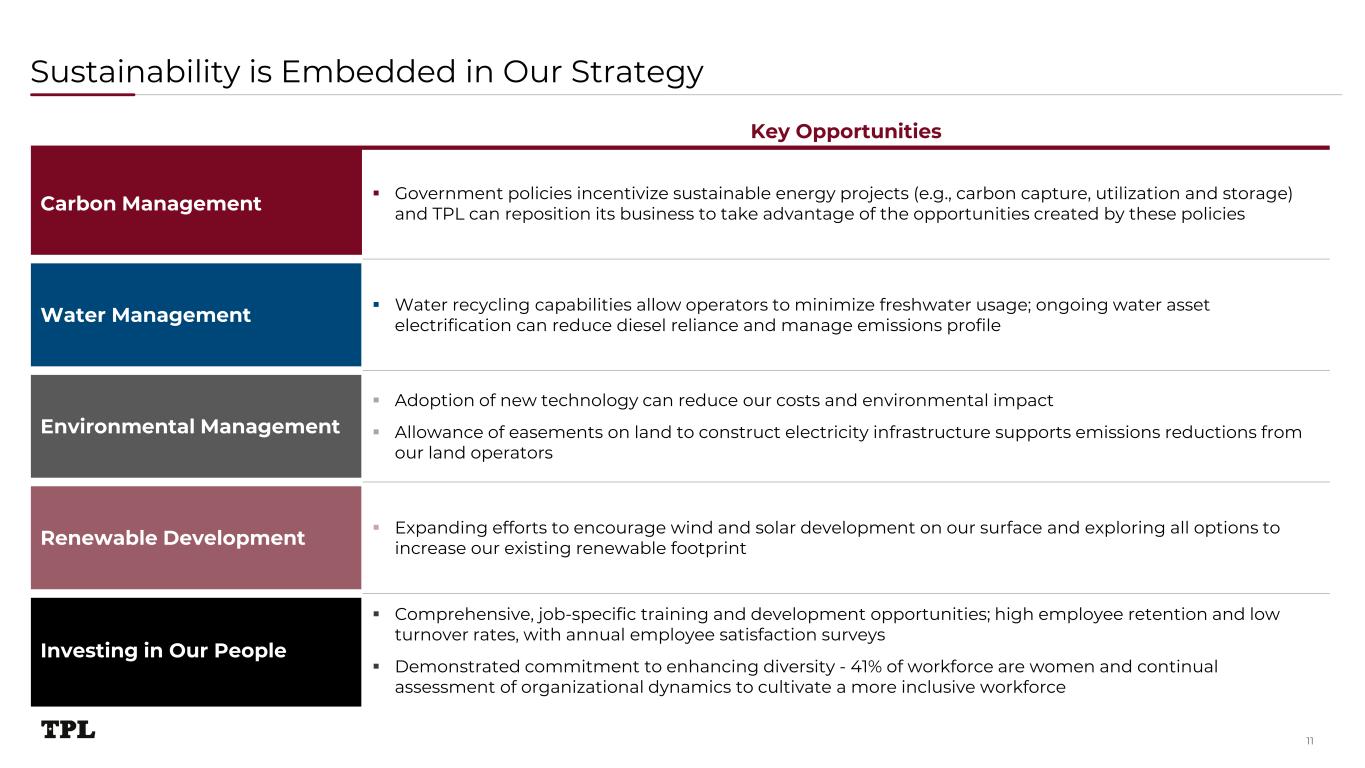
Sustainability is Embedded in Our Strategy 11 Key Opportunities Carbon Management Government policies incentivize sustainable energy projects (e.g., carbon capture, utilization and storage) and TPL can reposition its business to take advantage of the opportunities created by these policies Water Management Water recycling capabilities allow operators to minimize freshwater usage; ongoing water asset electrification can reduce diesel reliance and manage emissions profile Environmental Management Adoption of new technology can reduce our costs and environmental impact Allowance of easements on land to construct electricity infrastructure supports emissions reductions from our land operators Renewable Development Expanding efforts to encourage wind and solar development on our surface and exploring all options to increase our existing renewable footprint Investing in Our People Comprehensive, job-specific training and development opportunities; high employee retention and low turnover rates, with annual employee satisfaction surveys Demonstrated commitment to enhancing diversity - 41% of workforce are women and continual assessment of organizational dynamics to cultivate a more inclusive workforce
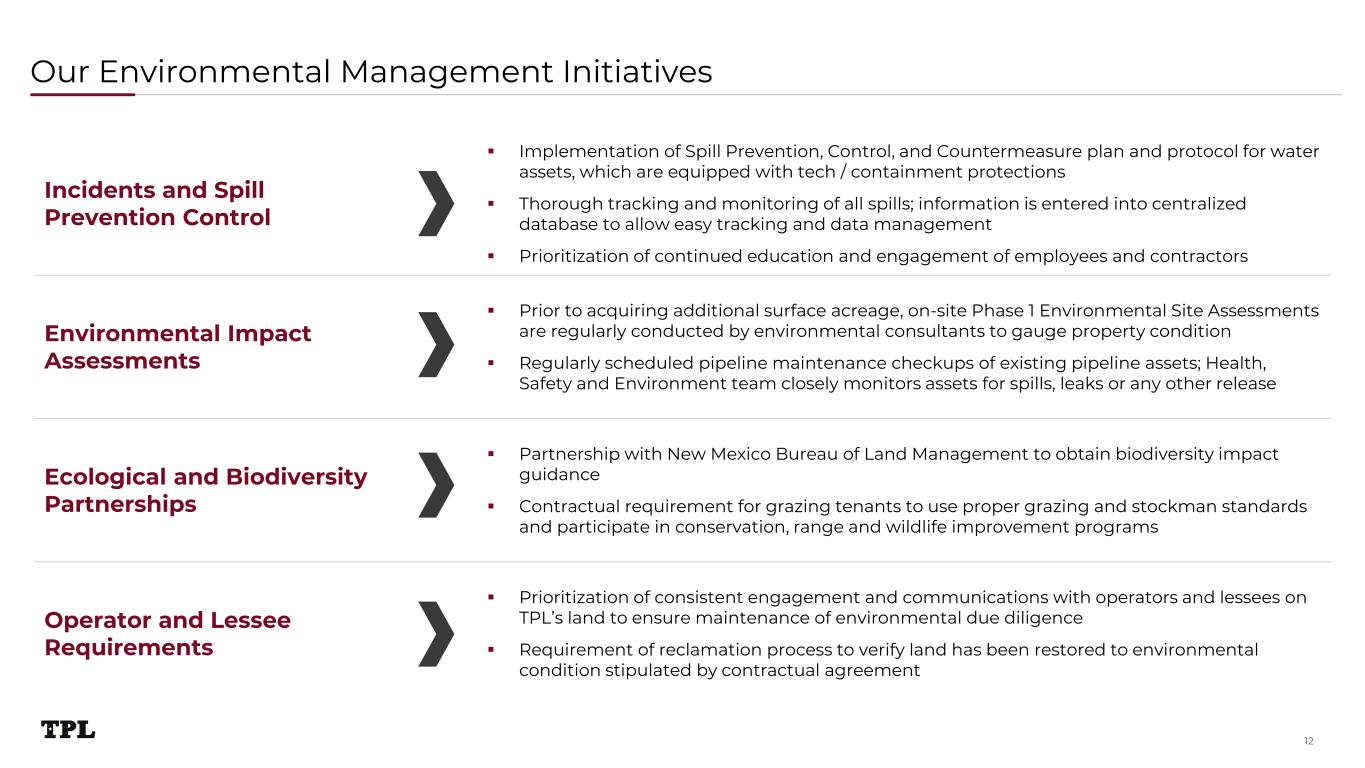
Our Environmental Management Initiatives 12 Incidents and Spill Prevention Control Implementation of Spill Prevention, Control, and Countermeasure plan and protocol for water assets, which are equipped with tech / containment protections Thorough tracking and monitoring of all spills; information is entered into centralized database to allow easy tracking and data management Prioritization of continued education and engagement of employees and contractors Environmental Impact Assessments Prior to acquiring additional surface acreage, on-site Phase 1 Environmental Site Assessments are regularly conducted by environmental consultants to gauge property condition Regularly scheduled pipeline maintenance checkups of existing pipeline assets; Health, Safety and Environment team closely monitors assets for spills, leaks or any other release Ecological and Biodiversity Partnerships Partnership with New Mexico Bureau of Land Management to obtain biodiversity impact guidance Contractual requirement for grazing tenants to use proper grazing and stockman standards and participate in conservation, range and wildlife improvement programs Operator and Lessee Requirements Prioritization of consistent engagement and communications with operators and lessees on TPL’s land to ensure maintenance of environmental due diligence Requirement of reclamation process to verify land has been restored to environmental condition stipulated by contractual agreement
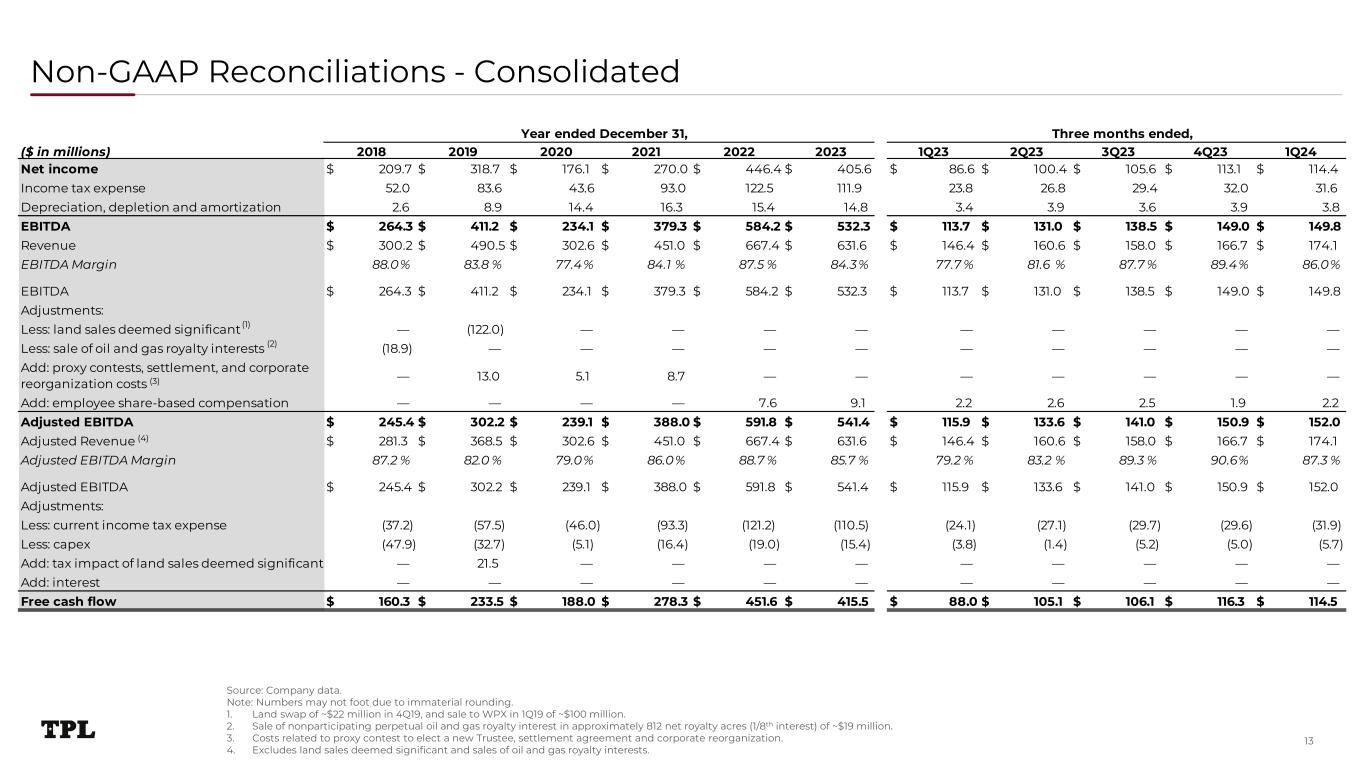
Year ended December 31, Three months ended, ($ in millions) 2018 2019 2020 2021 2022 2023 1Q23 2Q23 3Q23 4Q23 1Q24 Net income 209.7$ 318.7$ 176.1$ 270.0$ 446.4$ 405.6$ 86.6$ 100.4$ 105.6$ 113.1$ 114.4$ Income tax expense 52.0 83.6 43.6 93.0 122.5 111.9 23.8 26.8 29.4 32.0 31.6 Depreciation, depletion and amortization 2.6 8.9 14.4 16.3 15.4 14.8 3.4 3.9 3.6 3.9 3.8 EBITDA 264.3$ 411.2$ 234.1$ 379.3$ 584.2$ 532.3$ 113.7$ 131.0$ 138.5$ 149.0$ 149.8$ Revenue 300.2$ 490.5$ 302.6$ 451.0$ 667.4$ 631.6$ 146.4$ 160.6$ 158.0$ 166.7$ 174.1$ EBITDA Margin 88.0% 83.8 % 77.4% 84.1 % 87.5 % 84.3% 77.7 % 81.6 % 87.7 % 89.4% 86.0% EBITDA 264.3$ 411.2$ 234.1$ 379.3$ 584.2$ 532.3$ 113.7$ 131.0$ 138.5$ 149.0$ 149.8$ Adjustments: Less: land sales deemed significant — (122.0) — — — — — — — — — Less: sale of oil and gas royalty interests (18.9) — — — — — — — — — — Add: proxy contests, settlement, and corporate reorganization costs — 13.0 5.1 8.7 — — — — — — — Add: employee share-based compensation — — — — 7.6 9.1 2.2 2.6 2.5 1.9 2.2 Adjusted EBITDA 245.4$ 302.2$ 239.1$ 388.0$ 591.8$ 541.4$ 115.9$ 133.6$ 141.0$ 150.9$ 152.0$ Adjusted Revenue 281.3$ 368.5$ 302.6$ 451.0$ 667.4$ 631.6$ 146.4$ 160.6$ 158.0$ 166.7$ 174.1$ Adjusted EBITDA Margin 87.2 % 82.0 % 79.0% 86.0% 88.7 % 85.7 % 79.2 % 83.2 % 89.3 % 90.6% 87.3 % Adjusted EBITDA 245.4$ 302.2$ 239.1$ 388.0$ 591.8$ 541.4$ 115.9$ 133.6$ 141.0$ 150.9$ 152.0$ Adjustments: Less: current income tax expense (37.2) (57.5) (46.0) (93.3) (121.2) (110.5) (24.1) (27.1) (29.7) (29.6) (31.9) Less: capex (47.9) (32.7) (5.1) (16.4) (19.0) (15.4) (3.8) (1.4) (5.2) (5.0) (5.7) Add: tax impact of land sales deemed significant — 21.5 — — — — — — — — — Add: interest — — — — — — — — — — — Free cash flow 160.3$ 233.5$ 188.0$ 278.3$ 451.6$ 415.5$ 88.0$ 105.1$ 106.1$ 116.3$ 114.5$ Non-GAAP Reconciliations - Consolidated Source: Company data. Note: Numbers may not foot due to immaterial rounding. 1. Land swap of ~$22 million in 4Q19, and sale to WPX in 1Q19 of ~$100 million. 2. Sale of nonparticipating perpetual oil and gas royalty interest in approximately 812 net royalty acres (1/8th interest) of ~$19 million. 3. Costs related to proxy contest to elect a new Trustee, settlement agreement and corporate reorganization. 4. Excludes land sales deemed significant and sales of oil and gas royalty interests. 13 (1) (2) (3) (4)
Disclaimers This presentation has been designed to provide general information about Texas Pacific Land Corporation and its subsidiaries (“TPL” or the “Company”). Any information contained or referenced herein is suitable only as an introduction to the Company. The recipient is strongly encouraged to refer to and supplement this presentation with information the Company has filed with the Securities and Exchange Commission (“SEC”). The Company makes no representation or warranty, express or implied, as to the accuracy or completeness of the information contained in this presentation, and nothing contained herein is, or shall be, relied upon as a promise or representation, whether as to the past or to the future. This presentation does not purport to include all of the information that may be required to evaluate the subject matter herein and any recipient hereof should conduct its own independent analysis of the Company and the data contained or referred to herein. Unless otherwise stated, statements in this presentation are made as of the date of this presentation, and nothing shall create an implication that the information contained herein is correct as of any time after such date. TPL reserves the right to change any of its opinions expressed herein at any time as it deems appropriate. The Company disclaims any obligations to update the data, information or opinions contained herein or to notify the market or any other party of any such changes, other than required by law. Industry and Market Data The Company has neither sought nor obtained consent from any third party for the use of previously published information. Any such statements or information should not be viewed as indicating the support of such third party for the views expressed herein. The Company shall not be responsible or have any liability for any misinformation contained in any third party report, SEC or other regulatory filing. The industry in which the Company operates is subject to a high degree of uncertainty and risk due to a variety of factors, which could cause our results to differ materially from those expressed in these third-party publications. Some of the data included in this presentation is based on TPL’s good faith estimates, which are derived from TPL’s review of internal sources as well as the third party sources described above. All registered or unregistered service marks, trademarks and trade names referred to in this presentation are the property of their respective owners, and TPL’s use herein does not imply an affiliation with, or endorsement by, the owners of these service marks, trademarks and trade names. Forward-looking Statements This presentation contains certain forward-looking statements within the meaning of the U.S. federal securities laws that are based on TPL’s beliefs, as well as assumptions made by, and information currently available to, TPL, and therefore involve risks and uncertainties that are difficult to predict. These statements include, but are not limited to, statements about strategies, plans, objectives, expectations, intentions, expenditures and assumptions and other statements that are not historical facts. When used in this document, words such as “anticipate,” “believe,” “estimate,” “expect,” “intend,” “plan” and “project” and similar expressions are intended to identify forward- looking statements. You should not place undue reliance on these forward-looking statements. Although we believe our plans, intentions and expectations reflected in or suggested by the forward-looking statements we make in this presentation are reasonable, we may be unable to achieve these plans, intentions or expectations and actual results, performance or achievements may vary materially and adversely from those envisaged in this document. For more information concerning factors that could cause actual results to differ from those expressed or forecasted, see TPL’s annual report on Form 10-K and quarterly reports on Form 10-Q filed with the SEC. The tables, graphs, charts and other analyses provided throughout this document are provided for illustrative purposes only and there is no guarantee that the trends, outcomes or market conditions depicted on them will continue in the future. There is no assurance or guarantee with respect to the prices at which the Company’s common stock will trade, and such securities may not trade at prices that may be implied herein. TPL’s forecasts and expectations for future periods are dependent upon many assumptions, including the drilling and development plans of our customers, estimates of production and potential drilling locations, which may be affected by commodity price declines or other factors that are beyond TPL’s control. These materials are provided merely for general informational purposes and are not intended to be, nor should they be construed as 1) investment, financial, tax or legal advice, 2) a recommendation to buy or sell any security, or 3) an offer or solicitation to subscribe for or purchase any security. These materials do not consider the investment objective, financial situation, suitability or the particular need or circumstances of any specific individual who may receive or review this presentation, and may not be taken as advice on the merits of any investment decision. Although TPL believes the information herein to be reliable, the Company and persons acting on its behalf make no representation or warranty, express or implied, as to the accuracy or completeness of those statements or any other written or oral communication it makes, safe as provided for by law, and the Company expressly disclaims any liability relating to those statements or communications (or any inaccuracies or omissions therein). These cautionary statements qualify all forward-looking statements attributable to us or persons acting on our behalf. Non-GAAP Financial Measures In addition to amounts presented in accordance with generally accepted accounting principles in the United States of America (“GAAP”), this presentation includes certain supplemental non-GAAP measurements. These non- GAAP measurements are not to be considered more relevant or accurate than the measurements presented in accordance with GAAP. In compliance with requirements of the SEC, our non-GAAP measurements are reconciled to net income, the most directly comparable GAAP performance measure. In this presentation, TPL utilizes earnings before interest, taxes, depreciation and amortization (“EBITDA”), Adjusted EBITDA and free cash flow (“FCF”). TPL believes that EBITDA, Adjusted EBITDA and FCF are useful supplements as an indicator of operating and financial performance. EBITDA, Adjusted EBITDA and FCF are not presented as an alternative to net income and they should not be considered in isolation or as a substitute for net income. See Appendix for a reconciliation of these non-GAAP measures to net income, the most directly comparable financial measure calculated in accordance with GAAP. 14
1700 Pacific Avenue, Suite 2900 Dallas, Texas 75201 Texas Pacific Land Corporation