
About TPL
Texas Pacific Land Corporation (“TPL”, “Texas Pacific”, the “Company, “our”, “we”, or “us”) has a longstanding history as one of the largest landowners in the State of Texas with approximately 873,000 surface acres of land in West Texas, principally concentrated in the Permian Basin. We have a unique structure in that we are not an oil and gas producer, but we instead generate revenue through royalty interests throughout the oil and gas development value chain.
The Company was originally organized as Texas Pacific Land Trust (the “Trust”) under a Declaration of Trust, dated February 1, 1888, to receive and hold title to extensive tracts of land in the State of Texas, previously the property of the Texas and Pacific Railway Company. On January 11, 2021, the Trust completed its reorganization from a business trust, Texas Pacific Land Trust, into Texas Pacific Land Corporation. We are proud of our history as one of the few Depression Era companies that continue trading on the New York Stock Exchange today, almost a century later. We believe this is a representation of our ability to generate stockholder value and continuously evolve our operations within the marketplace.
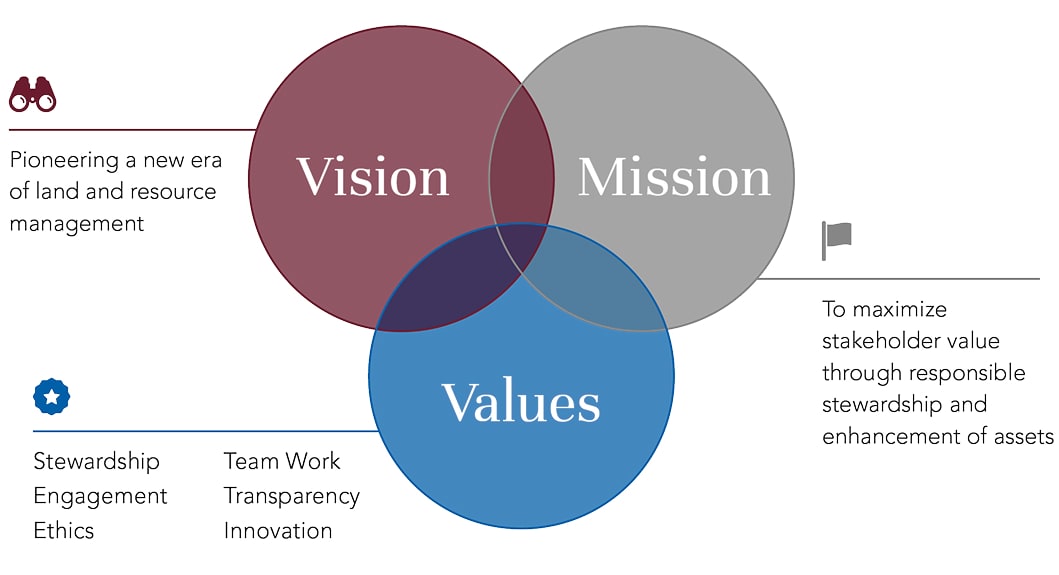
Our mission is to pursue a thoughtful, long-term approach towards optimizing and building upon the commercial and environmental virtues of our extensive lands and resources. We have a long history of responsible management of our legacy assets and currently operate two business segments: Land and Resource Management and Water Services and Operations. We continue to explore new opportunities related to renewable energy, environmental, sustainability, and technology, among others, which can leverage our existing legacy surface and royalty assets.
Land and Resource Management
Our Land and Resource Management segment encompasses the business of managing our approximately 873,000 surface acres of land and approximately 207,000 net royalty acres of oil and gas royalty interests, principally concentrated in the Permian Basin. The revenue streams of this segment consist primarily of royalties from oil and gas, revenues from easements, commercial leases and renewables, and land and material sales.

Water Services and Operations
Our Water Services and Operations segment is committed to sustainable water development and encompasses the business of providing full-service water offerings to operators in the Permian Basin through Texas Pacific Water Resources LLC (“TPWR”). Our significant surface ownership in the Permian Basin provides TPWR with a unique opportunity to provide multiple full-service water offerings to operators, which include, but are not limited to, water sourcing, produced-water treatment, infrastructure development, and disposal solutions.
Our Partnership with Oil & Gas Lessees
As TPL does not produce oil and gas from the land from which our royalty revenue stream is derived, our sustainability goals and partnership opportunities are developed in consultation with the entities operating on our land. By partnering with these entities, we are able to achieve the following outcomes:
- Foster innovative technologies that support emissions management;
- Develop renewable energy buildout across TPL’s land;
- Implement electrification and energy efficiency projects that support the low-carbon goals of operators;
- Build out water infrastructure to support the mitigation and response to climate change;
- Enhance community-level engagements, social investments, and volunteering; and
- Partner with emergency responders in TPL communities.
Throughout this ESG Website, we will provide additional details on the ways in which we work with oil and gas operators to fulfill the objectives of our sustainability program.
About our ESG Disclosures
We are pleased to present our 2024 ESG Website disclosures, which demonstrate TPL’s commitment to sustainable practices throughout our operations. Our ESG disclosure has been informed by the Sustainability Accounting Standards Board (“SASB”), Global Reporting Initiative (“GRI”), and the Task Force on Climate-Related Disclosures (“TCFD”) frameworks. The data disclosed in this website covers all of our operations for the fiscal year ending December 31, 2024, unless otherwise noted. Given the dynamic nature of ESG priorities and best practices, assessments and reviews of our metrics and disclosure policies will continue to be evaluated and, if necessary, adjusted on a regular basis.
If you have questions or comments, please contact us at IR@texaspacific.com.
ESG Strategy
Texas Pacific’s Core Values act as guiding principles underlying our business conduct and engagement with partners and stakeholders. Since 1888, when Texas Pacific was first established as a land trust, our commitment to long-term success has been dependent on adapting to dynamic market forces and doing what is right for all stakeholders.
Our Core Values align with our strategic and operational priorities, as well as our Environmental, Social, and Governance (“ESG”) commitments. Our ESG strategy reflects our dedication to meeting tactical business priorities while managing the environmental impacts of our operations, maintaining principles for social responsibility, and upholding a commitment to strong corporate governance.
Our Commitment to Corporate Responsibility
TPL is positioned to proactively and holistically manage our ESG risks and opportunities, which in turn provides our communities, stakeholders, stockholders, lessees, and operators with confirmation that our company is prioritizing the necessary items to generate long-term value and support sustainability excellence.
Our ESG strategy is focused on the overarching priorities of environmental management, employee health and safety, workforce management and equality, community and landowner engagement, and strong corporate governance and ethics. We are committed to working towards a sustainable future and operating in a responsible manner across all of our operations and land management activities. We strive to uphold the highest standards of ethics, transparency, and accountability, and we foster the safe and responsible development of our lands.
As TPL does not produce oil or gas from the land from which our royalty revenue stream is derived, we developed our sustainability goals and partnership opportunities in consultation with the entities operating on those lands. We maintain strong relationships with these operators to encourage environmental best practices as it relates to their specific infrastructure and operational requirements. In our Water Services and Operations segment, we have developed a tailored ESG program that speaks to the ethical and responsible buildout of our water assets and management of water as a natural resource. Our continued goal is an integrated and iterative approach to sustainable and responsible resource management.
TPL continues to partner with an external ESG consulting firm to independently assess our operations, business practices and procedures, and cultural enablers. This allows us to identify opportunities to improve processes and incorporate best practices where possible.
ESG Leadership and Management Oversight
We believe effective oversight and implementation of our ESG strategy stems from the involvement of internal stakeholders throughout our business. As such, ESG-related responsibilities are apportioned to various departments and individuals throughout our Company, from upper leadership to entry-level employees. Our ESG internal oversight framework is comprised of leadership and employee subject-matter experts to ensure we remain ahead of the latest trends and developments in ESG and sustainability.
Beginning at the executive level, TPL’s ESG Leadership Committee provides critical oversight and direction regarding our ESG and sustainability business strategies. Additionally, our ESG Working Committee, comprised of our cross-functional subject matter experts, offers division-specific knowledge and accountability related to the ongoing development and evaluation of our initiatives. Both of these groups play a critical role in the oversight and implementation of TPL’s ESG strategy. For additional details on the responsibilities of each group, refer to Management’s Role in Assessing and Managing Climate Risks and Opportunities.
Board of Directors |
|||||
|---|---|---|---|---|---|
| ESG Executive Leadership Committee | |||||
Tyler GloverCEO |
Chris SteddumCFO |
Michael DobbsSVP & General Counsel |
|||
| ESG Working Committee | |||||
| VP Corporate Strategy | Director of Land | VP Finance & IR | |||
| HSE Manager | Director of Human Resources | Director of IT | |||
| Director of Operations | Director of Internal Audit | Chief Accounting Officer | |||
| Director of Accounting | |||||
Forward-Looking Statements
This presentation contains certain forward-looking statements within the meaning of the U.S. federal securities laws that are based on TPL’s beliefs, as well as assumptions made by, and information currently available to, TPL, and therefore involve risks and uncertainties that are difficult to predict. These statements include, but are not limited to, statements about strategies, plans, objectives, expectations, intentions, expenditures and assumptions and other statements that are not historical facts. When used in this document, words such as “anticipate,” “believe,” “estimate,” “expect,” “intend,” “plan” and “project” and similar expressions are intended to identify forward-looking statements. You should not place undue reliance on these forward-looking statements. Although we believe our plans, intentions and expectations reflected in or suggested by the forward-looking statements we make in this presentation are reasonable, we may be unable to achieve these plans, intentions or expectations and actual results, performance or achievements may vary materially and adversely from those envisaged in this document. For more information concerning factors that could cause actual results to differ from those expressed or forecasted, see TPL’s annual report on Form 10-K and quarterly reports on Form 10-Q filed with the SEC. The tables, graphs, charts and other analyses provided throughout this document are provided for illustrative purposes only and there is no guarantee that the trends, outcomes or market conditions depicted in them will continue in the future. There is no assurance or guarantee with respect to the prices at which the Company’s common stock will trade, and such securities may not trade at prices that may be implied herein.
TPL’s forecasts and expectations for future periods are dependent upon many assumptions, including the drilling and development plans of our customers, estimates of production and potential drilling locations, which may be affected by commodity price declines, or other factors that are beyond TPL’s control.
These materials are provided merely for general informational purposes and are not intended to be, nor should they be construed as 1) investment, financial, tax or legal advice, 2) a recommendation to buy or sell any security, or 3) an offer or solicitation to subscribe for or purchase any security. These materials do not consider the investment objective, financial situation, suitability or the particular need or circumstances of any specific individual who may receive or review this presentation, and these materials may not be taken as advice on the merits of any investment decision. Although TPL believes the information herein to be reliable, the Company and persons acting on its behalf make no representation or warranty, express or implied, as to the accuracy or completeness of those statements or any other written or oral communication it makes, save as provided for by law, and the Company expressly disclaims any liability relating to those statements or communications (or any inaccuracies or omissions therein). These cautionary statements qualify all forward-looking statements attributable to us or persons acting on our behalf.